

SQL Interview Questions for Data Analysts in 2025: Real Scenarios + Answers


Introduction
If you’re interviewing for a data analyst role this year, SQL is a skill that remains non-negotiable.
It’s the universal language of data, the bridge between raw tables and real insights. Whether you’re building retention dashboards, cleaning messy datasets, or calculating KPIs for leadership, SQL sits at the heart of every analyst’s toolkit.
In today’s interview landscape, where companies use Snowflake, BigQuery, Redshift, and AI-assisted analytics tools, SQL still dominates because it reveals how you think, not just what you know.
This guide breaks down everything you’ll encounter from beginner-friendly joins to senior-level tuning problems, along with examples, explanations, and real interview links from top companies. Whether you’re brushing up before a screen or targeting a senior analytics role, you’ll learn how to write queries that are both correct and efficient, and how to communicate your logic clearly under pressure.
How SQL Shows Up in Data Analyst Interviews (and Why It Still Dominates)
If you’re preparing for a data analyst interview, expect SQL to be front and center. No matter how advanced the tooling landscape gets, with dashboards powered by Looker, dbt-driven transformations, or AI copilots writing snippets, SQL for data analyst interview questions remains the gold standard for testing core analytical ability.
Where You’ll See SQL Tested

- Screening rounds: quick SQL challenges that test your ability to filter, join, and aggregate on the fly.
- On-screen tasks: shared-screen exercises where you query live data or mock datasets in platforms like BigQuery or Snowflake.
- Take-home assignments: scenario-driven questions (e.g., “Identify churn risk segments from this dataset”) that require end-to-end querying and analysis.
- Whiteboard or verbal walk-throughs: explaining how you’d structure a query without writing code, useful for testing conceptual clarity under pressure.
Why SQL Still Dominates in 2025
Despite AI tools generating queries automatically, hiring managers continue to test SQL directly because:
- Ubiquity: SQL remains the universal interface for data, powering systems from Redshift to Databricks.
- Efficiency: Analysts who can independently slice data accelerate insights without waiting for engineering hand-offs.
- Trust factor: Clean, optimized SQL is seen as a proxy for analytical rigor, data literacy, and attention to detail.
That’s why practicing common SQL interview questions for data analysts isn’t optional, it’s expected. Whether it’s identifying duplicates, calculating running totals, or building cohort analyses, SQL is how you prove you can translate raw data into business insights.
Quick Index—Jump to Your Level
- Beginner SQL Interview Questions for Data Analysts (with Answers)
- Intermediate SQL Questions: Window Functions, Subqueries, CASE
- Scenario-Based SQL Questions for Data Analysts (Real Business Use-Cases)
- Advanced & Senior-Level SQL: Query Tuning, Indexing, EXPLAIN
- Tool-Specific: MySQL, Postgres, BigQuery, SQL Server Differences
- 25 Hand-Picked Practice Questions (Copy-Ready Schemas + Answers)
- How to Prepare in 7–14 Days (Study Plan + Checklist)
- Related Roles & Next Steps
- FAQs
Beginner SQL Interview Questions for Data Analysts (with Answers)
These basic SQL interview questions for data analysts are the foundation of almost every technical screen. They tend to appear early in the hiring funnel—recruiter screens, online assessments, or short take-homes. While syntax is tested, companies really care about how you approach problems, structure logic, and apply SQL to real-world data scenarios.
Read more: How to Get a Data Analyst Internship
Each of the categories below maps directly to core SQL skills that hiring managers expect every analyst to master.
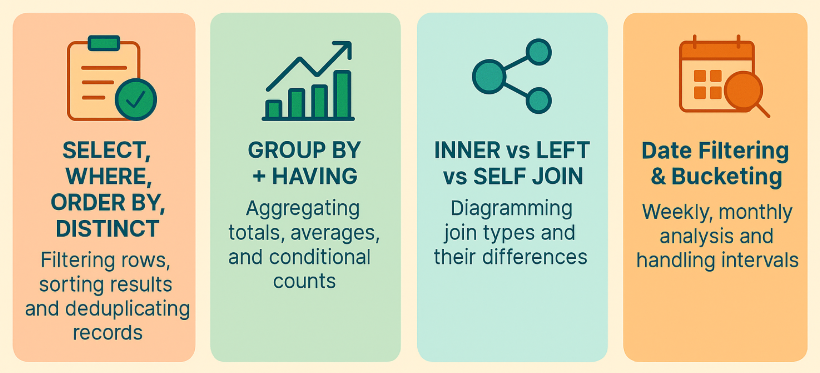
SELECT, WHERE, ORDER BY, DISTINCT
The absolute basics of querying: filtering rows, sorting results, and deduplicating records. These skills test whether you can extract the right slice of data from raw tables.
GROUP BY + HAVING (aggregations)
Summarization lies at the heart of analytics. GROUP BY and HAVING test whether you can compute metrics like totals, averages, and conditional counts correctly.
INNER vs LEFT vs SELF JOIN
Joining tables is the bread and butter of data analysis. Expect questions where you must decide which type of join to use, and why, in order to avoid dropping records or duplicating counts.
Date Filtering & Bucketing (weekly/monthly)
Since most analyses are time-based, interviewers love to test filtering by date ranges, creating weekly/monthly buckets, and handling missing time intervals.
Below are 20 beginner level SQL query interview questions for data analyst roles.
Write a query that returns all neighborhoods that have 0 users.
This question tests
LEFT JOINsandNULLhandling. It’s specifically about detecting neighborhoods with no matching user records. To solve this,LEFT JOINneighborhoods to users onneighborhood_idand filter rows where the user side isNULL. In practice, this pattern is used to find coverage gaps, under-served areas, or data integrity issues.Select the 2nd highest salary in the engineering department
This question tests basic ranking and de-duplication. It’s specifically about excluding the maximum and retrieving the next highest value within a department filter. To solve this, filter to engineering and use a ranking function (e.g.,
ROW_NUMBER/DENSE_RANK) orORDER BYwithLIMIT/OFFSETto fetch the second highest salary. In real analytics, this helps with compensation benchmarking and percentile-based reporting.Count transactions filtered by several criterias.
This question tests filtering with
WHEREand basicCOUNTaggregation. It’s specifically about applying multiple conditions (e.g., date range, payment method, status) before counting. To solve this, add all constraints inWHEREand useCOUNT(*)(orCOUNT DISTINCT transaction_id) to get the final total. In practice, filtered counts underpin KPI dashboards like daily orders, successful payments, or refund rates.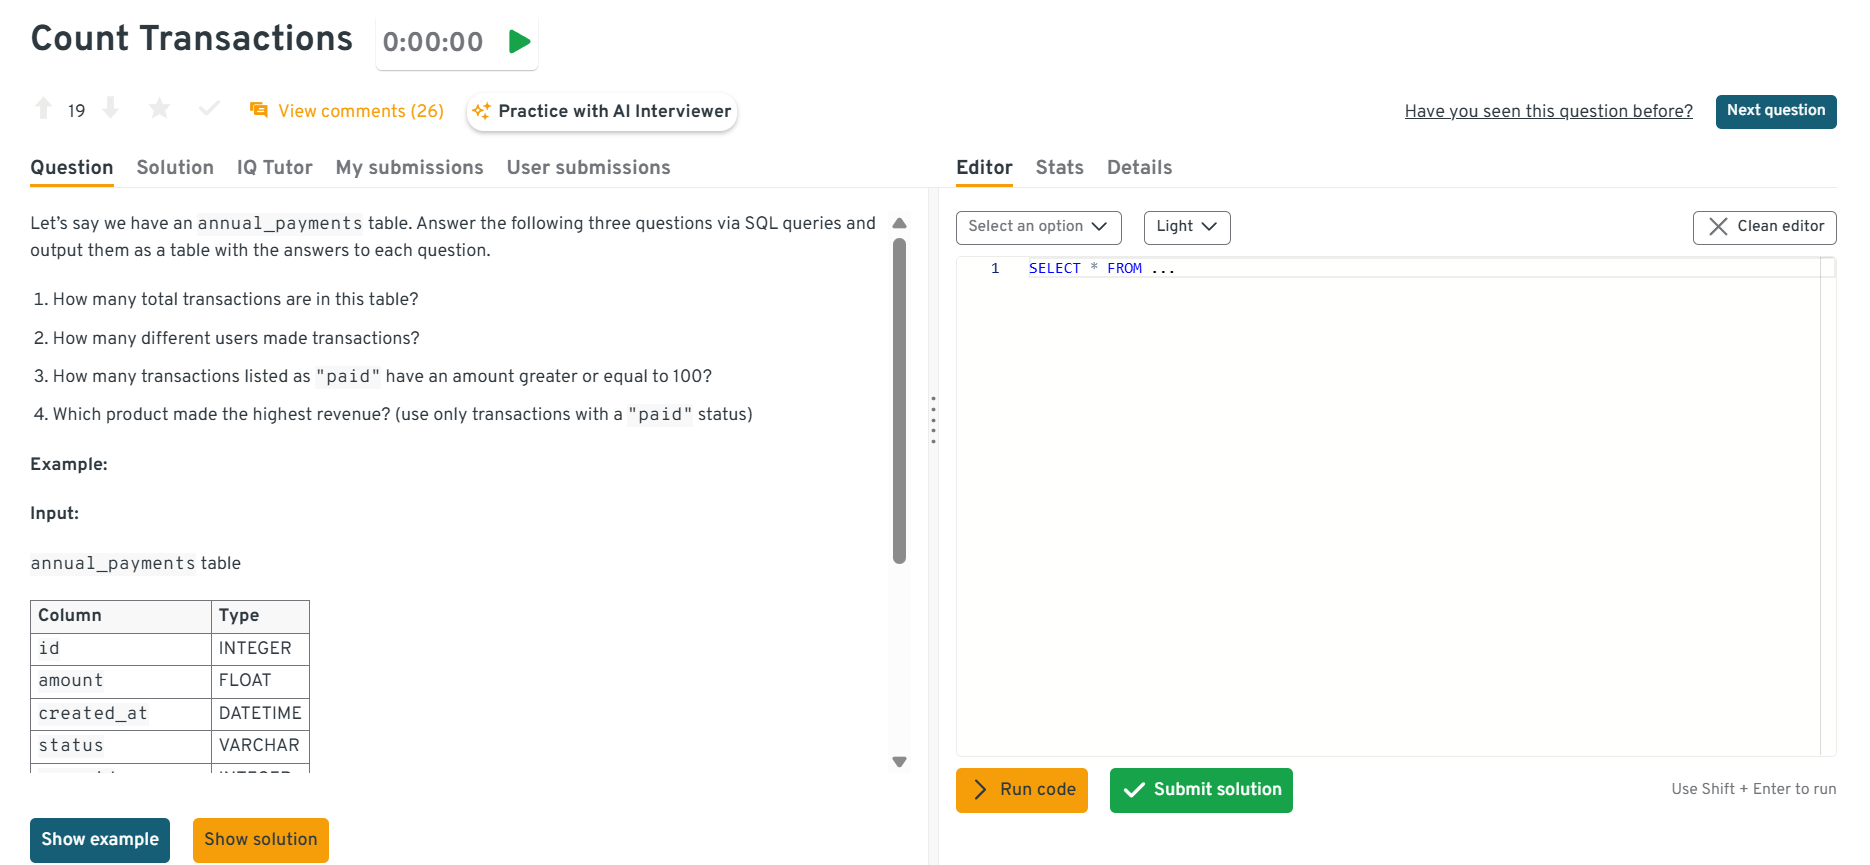
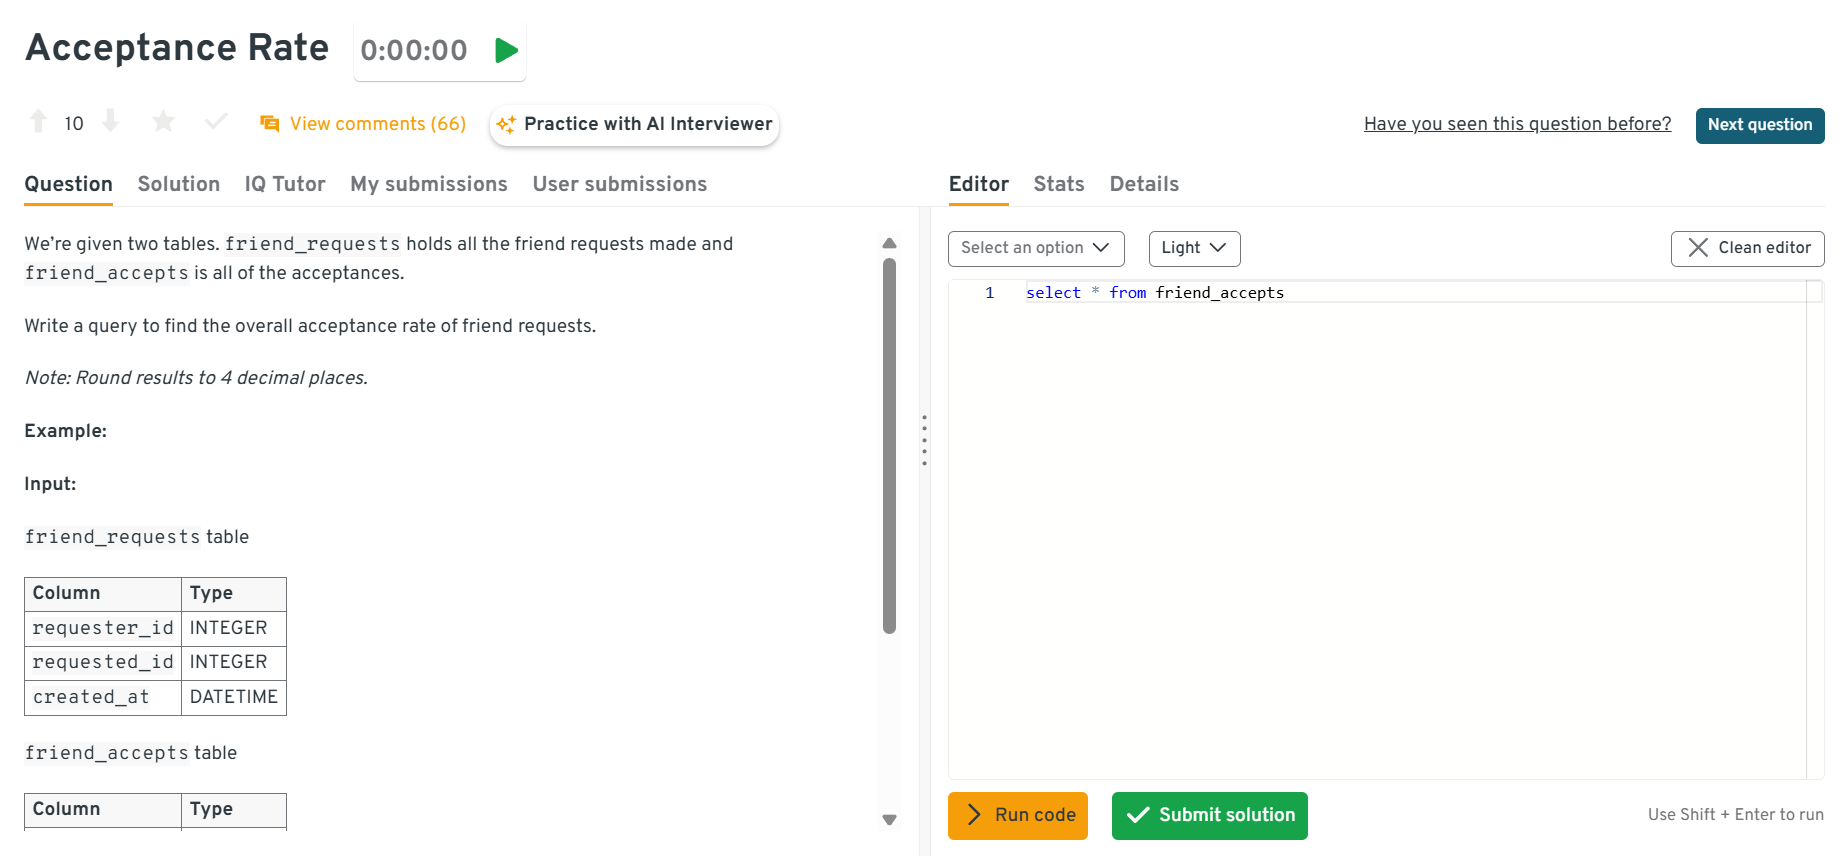
This interactive Interview Query dashboard lets you practice real-world SQL interview questions in a live coding environment. You can write, run, and submit queries while getting instant feedback, perfect for mastering scenario-based SQL problems across domains.
Find the total number of orders placed by a specific customer and list all customers with their total orders.
This question tests filtering plus grouped counts. It’s specifically about first querying one customer’s order count, then generalizing to all customers. To solve this,
GROUP BYcustomer_idandCOUNT(order_id), adding aWHEREclause for the single-customer case. In practice, per-customer order counts are a core building block for retention, frequency, and cohort analyses.Find the average number of downloads for free vs paying accounts, broken down by day.
This question tests dataset filtering. It’s asked to see if you can isolate subsets of downloads by attributes. To solve this, apply
WHEREclauses andCOUNT(). This supports analytics pipelines measuring app activity.Update a cumulative song count table based on daily listen records.
This question tests your understanding of joins and incremental aggregation over time. It’s asked to evaluate whether you can correctly compute ongoing totals from daily log data and merge them into an existing summary table. To solve this, you would start by grouping the
daily_listenstable bysong_idand summing up the listens for each day usingSUM(). This result is then joined with the cumulative table using aLEFT JOINorMERGE, and the values are either updated or inserted depending on whether the song already exists. In real-world applications, this mirrors analytics pipelines that track metrics like total plays, active users, or cumulative revenue over time.Calculate the average salary of software engineers.
This question tests your ability to use
AVG()and filtering conditions. It’s asked to check if you can apply WHERE filters to specific job roles and then compute aggregates. To solve this, you’d filter employees whererole = 'Engineer'and applyAVG(salary). In practice, this mimics reporting on compensation bands or tracking pay across departments.Count users without transactions.
This question tests your understanding of joins and NULL handling. It’s asked to evaluate if you can correctly identify users who don’t appear in a fact table. To solve this, you’d
LEFT JOINusers with transactions and filter forWHERE transaction_id IS NULL. In real-world use, this reflects churn analysis or identifying inactive customers.Calculate total card transactions.
This question tests your skills in filtering and aggregation. It’s asked to check if you can isolate transaction types and compute total amounts. To solve this, filter
WHERE method = 'card'and sumamountusingSUM(). In business, this reflects payments reporting—like splitting card vs cash payments.Calculate failed requests by country.
This question tests your grouping and conditional filtering. It’s asked to ensure you can segment results by geography and filter on status codes. To solve this, group by
country, filter for failed codes (status != 200), and count them. In production, this is key to monitoring error rates in web services.Generate a customer spending report.
This question tests your ability to group by users and aggregate spend. It’s asked to evaluate whether you can build per-customer metrics from transactional data. To solve this, group by
customer_idand useSUM(amount)plus count distinct purchases. In the real world, this helps build dashboards for CLV (customer lifetime value).How much did 2022 sign-ups spend on every product?
This question tests joins, filtering by date attributes, and grouped aggregation. It’s specifically about joining 2022-registered users to their purchases and summing total spend per product. To solve this, filter users by
registration_year = 2022, join to purchases, and computeSUM(price * quantity)grouped by product_id. In practice, this reveals cohort-level spending patterns and is a core e-commerce metric.What query returns the maximum quantity bought for every product each year?
This question tests date extraction and per-group aggregation. It’s specifically about grouping by both product and year, then finding the maximum order quantity. To solve this, extract year from
order_date, group by year and product_id, and useMAX(quantity). In practice, this mirrors retail analysis of peak demand per product annually, critical for forecasting and supply chain planning.Write a query to find the overall acceptance rate of friend requests.
This question tests conditional aggregation. It’s specifically about computing offer acceptance rates. To solve this, use SUM(CASE WHEN accepted=1 THEN 1 ELSE 0 END)/COUNT(*) grouped by recruiter/team. In real-world analytics, this supports HR funnel metrics.
Write a query to get the average order value by gender.
This question tests aggregation. It’s specifically about computing spend per order and averaging across customers. To solve this, group by order_id, compute SUM(price*quantity), then AVG across orders. In practice, this is a foundational retail metric.
What share of Apple-platform actions ranked in the top-5 during November 2020?
You must filter on platform, restrict to November 2020, aggregate counts, then rank with
DENSE_RANK. Handling ties properly and producing an ordered output shows mastery of grouping plus ranking logic in real engagement analyses.How would you flag each purchase as either the customer’s first or a repeat in its product category?
Interviewers want to see whether you can leverage window functions (
ROW_NUMBER()orMIN(id) OVER (PARTITION BY user_id, category)) to mark a “first” versus subsequent purchase, then cast that boolean into a tidy feature column. A good solution joins no extra tables, sorts by purchase time, and explains why session-level deduping isn’t needed. Mentioning that this repeat-purchase label later feeds retention analyses shows business awareness while keeping the SQL lightweight.-
The query filters on the timestamp window, groups by both
ssidanddevice_id, counts packets, then appliesMAX()(orROW_NUMBER()withDESCordering) per SSID. Explaining that you choose an index on(ssid, created_at)to speed the time filter demonstrates practical sense, yet the core logic remains a straightforward aggregation—squarely entry-level. -
A clean answer uses
COUNT(DISTINCT employee_id)in the denominator, guarding against duplicates, then orders by the computed ratio and limits to five. The exercise spotlights practical data-quality thinking (deduping) without venturing into advanced optimization, making it a solid capstone basic query for new analysts. -
The task mixes filtering on a date range, aggregating counts, and ranking with
DENSE_RANK(). Candidates should explain tie handling and whyORDER BY action_count DESCbefore ranking is crucial. The scenario mirrors common engagement reporting—perfect for junior analysts who’ll build feature-usage tables.
Intermediate SQL Questions: Window Functions, Subqueries, CASE
These intermediate SQL interview questions move beyond the basics and test whether you can handle more complex, real-world analytical scenarios. By this stage, hiring managers expect you to know not just how to filter and join, but how to structure logic for ranking, windowing, conditional analysis, and subquery optimization.
Read more: SQL SUM CASE WHEN: Complete Guide to Conditional Aggregation
Each category below ties directly to what shows up in SQL technical interview questions for data analysts in 2025.
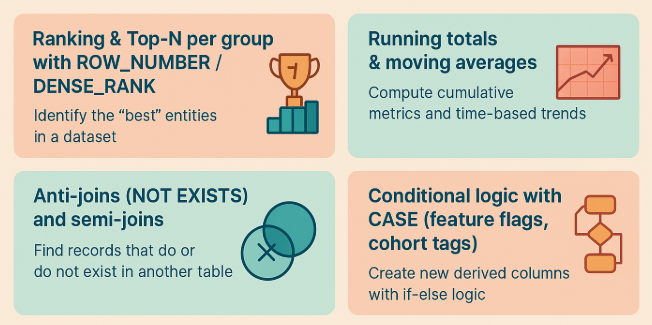
Ranking & Top-N per group with ROW_NUMBER/DENSE_RANK
These questions test whether you can identify the “best” or “top-N” entities in a dataset—like top customers, top products, or best-performing employees. Expect to use ROW_NUMBER(), RANK(), or DENSE_RANK().
Running totals & moving averages
This is where window functions shine. You’ll need to show you can compute cumulative metrics, rolling averages, and time-based trends that analysts often present in dashboards.
Anti-joins (NOT EXISTS) and semi-joins
Anti-joins identify records that don’t exist in another table, while semi-joins find those that do. These are key for problems like finding inactive customers or filtering overlapping datasets.
Conditional logic with CASE (feature flags, cohort tags)
CASE is SQL’s if-else statement. These questions test whether you can create new derived columns to bucket users, tag cohorts, or apply feature flags.
Below are 20 intermediate SQL technical interview questions for data analysts.
Write a query to select the top 3 departments by average salary
This question tests ranking and aggregation. It’s specifically about computing average salary per department and selecting the top three. To solve this, group by department, compute
AVG(salary), then applyORDER BYandLIMIT. In real analytics, this reflects benchmarking and compensation analysis across groups.Get the current salary for each employee.
This question tests anomaly detection with SQL. It’s specifically about identifying mismatched or inconsistent salary records due to ETL errors. To solve this, use joins or window functions to check duplicates, missing entries, or unexpected distributions. In business, this ensures data quality in payroll and finance systems.
Write a query that finds the third purchase of every user.
This question tests ranking with
ROW_NUMBER(). It’s specifically about isolating each customer’s third purchase. To solve this, partition bycustomer_id, order bypurchase_date, and select whererow_number = 3. In practice, analysts use this for lifecycle and retention insights.-
This question tests joins and comparisons. It’s specifically about identifying projects where actual spend exceeds budget. To solve this, join projects to expenditures and filter where spend > budget. In real-world analytics, this supports cost control and project management.
Select the student name combination that is higher in the alphabet.
This question tests self-joins and window functions. It’s specifically about finding the closest SAT score to a given benchmark. To solve this, compute
ABS(score - target)and useRANK()orORDER BYto return the nearest. In practice, this reflects nearest-neighbor lookups in education and assessment data.Write an SQL query to count comment upvotes
This question tests joins and aggregation. It’s specifically about calculating upvotes per comment. To solve this, join comments to votes and group by comment_id. In practice, this powers social interaction metrics.
Sample every 4th row ordered by the date.
This question tests date bucketing and aggregation. It’s specifically about sampling transactions into uniform time buckets. To solve this, truncate dates to day/week, group, and count. In practice, this powers dashboards with time-based KPIs.
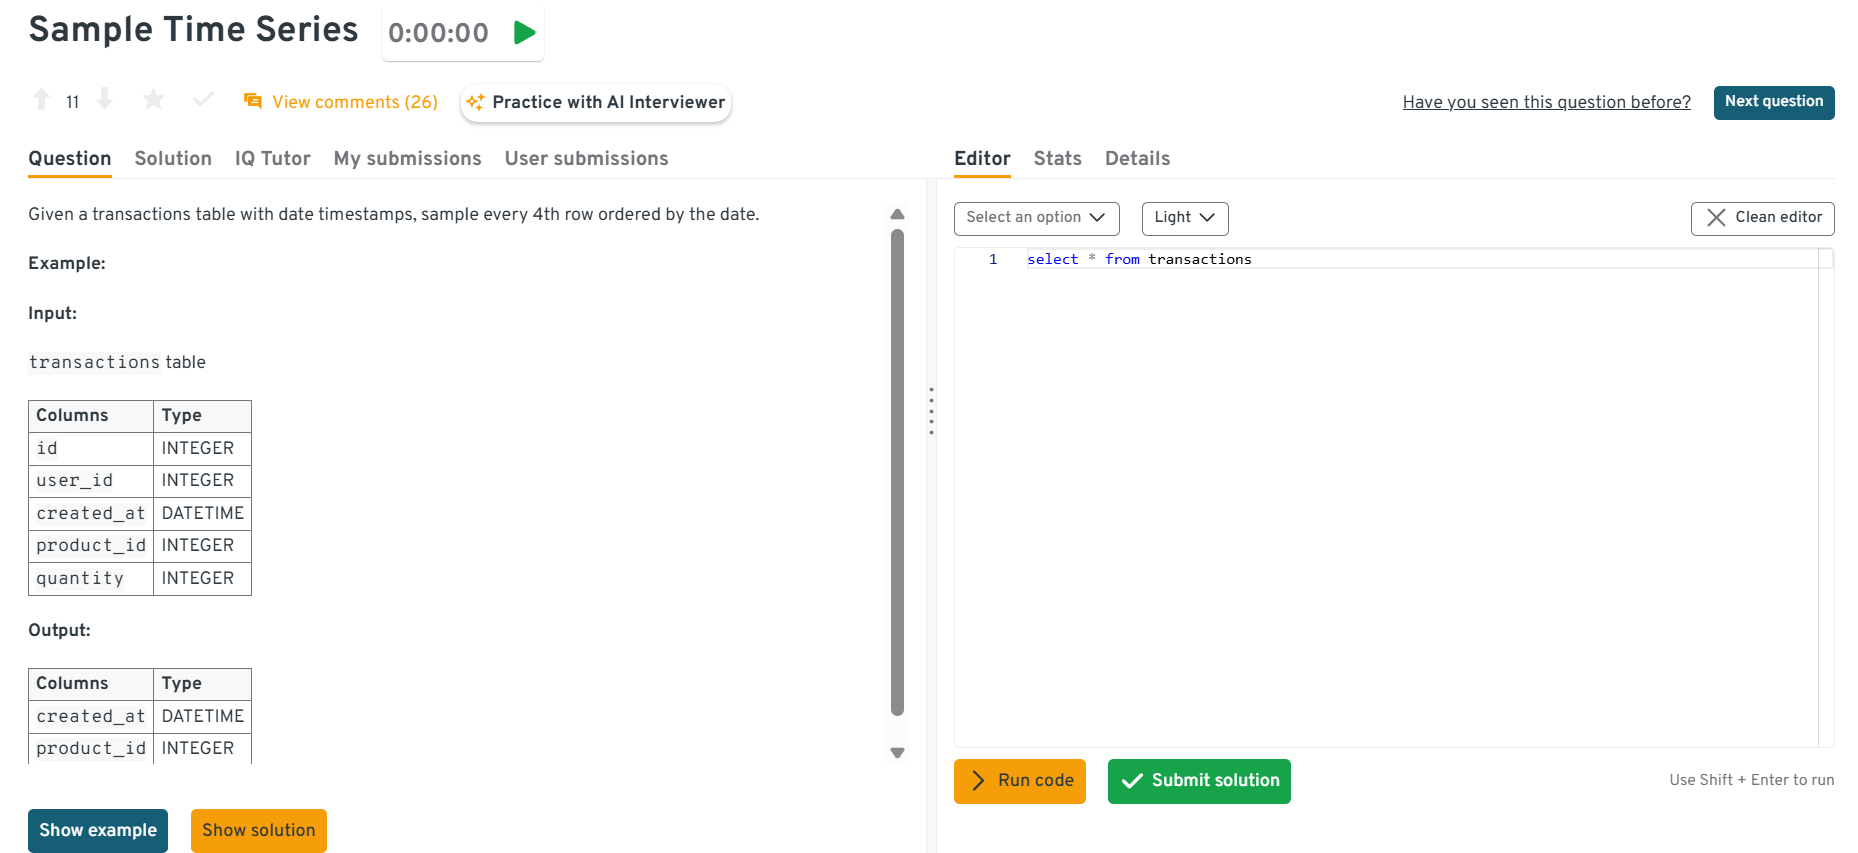
This interactive Interview Query dashboard lets you practice real-world SQL interview questions in a live coding environment. You can write, run, and submit queries while getting instant feedback, perfect for mastering scenario-based SQL problems across domains.
-
This question tests ranking and conditional filters. It’s specifically about ranking search results based on relevance or clicks. To solve this, partition by
query_id, order byrank_score, and applyRANK(). In practice, this underlies search quality measurement. Get the top five most expensive projects by budget to employee count ratio.
This question tests joins and aggregations. It’s specifically about summing employee allocations against project budgets. To solve this, join employee assignments to projects and aggregate. In practice, this helps track resourcing efficiency.
Find the month_over_month change in revenue for the year 2019.
This question tests date functions and window lag. It’s specifically about computing growth between months. To solve this, group by truncated month,
SUM(metric), then compute(curr - prev)/prev with LAG(). In practice, this is essential for growth tracking dashboards.-
This question tests filtering and subqueries. It’s specifically about finding accounts that were closed in a given timeframe. To solve this, filter accounts where status=closed and join to transactions for context. In practice, this is a KPI in banking churn analytics.
-
This question tests conditional aggregation and percentage calculations. It’s specifically about splitting comment counts by location (feed vs. mentions) and computing their share. To solve this, use
SUM(CASE WHEN … THEN 1 ELSE 0 END)to count each section, then divide by total comments and format as a percentage. In real-world product analytics, such splits reveal where engagement originates and guide UI/content placement decisions. Write a query to get the number of friends of a user that like a specific page
This question tests joins across relationship and action tables. It’s specifically about intersecting a user’s friend list with a page-likes table. To solve this, join the friendships table to
page_likesonfriend_idand filter by the page, thenCOUNT(*)(orCOUNT DISTINCT friend_id). In practice, this supports social graph analytics and targeted growth/virality tracking.Write a query to retrieve three columns product_id, product_price, and avg_transaction_total.
This question tests aggregation and comparison to a global metric. It’s specifically about selecting products priced above the average price across the catalog (or category). To solve this, compute
AVG(price)(optionally per category) and filter productsWHERE price > avg_priceusing a subquery or window function. In business reporting, this is a staple for pricing band analysis and premium-tier identification.Find the number of customers that were upsold
This question tests basic filtering, grouping, and counting. It’s specifically about finding how many customers completed an “upsell” purchase or event. To solve this, filter the transactions to the upsell condition, group by
customer_id, and countdistinctcustomers (or rows if one per customer). In the real world, this measures upsell penetration and helps analysts quantify revenue expansion opportunities.Write a query to get the average commute time for each commuter in New York
This question tests
GROUP BYandAVG. It’s specifically about computing mean commute duration per commuter within a city filter. To solve this, filter to New York, group bycommuter_id, and useAVG(commute_time)to produce per-person metrics. In real analytics, these per-entity averages feed performance tracking and service-level optimization.Who are the top three highest-earning employees in each department?
Using
employeesanddepartments, build a ranked list of the three largest salaries per department, outputting employee full name, department name, and salary. The question probes intermediate query construction: joining reference tables, applyingRANK()orDENSE_RANK(), and handling departments with fewer than three staff. A solid answer shows familiarity with window functions, tie-breaking rules, and ordering by multiple fields—skills that quickly separate candidates who only know basic aggregation from those who can craft polished reporting queries.Create a January-2020 histogram of comments per user, with one-comment bins.
From an
eventstable, count how many comments each user left in January 2020, then bucket those counts (0, 1, 2, …) and tally users per bucket. This query forces use of subqueries or CTEs for per-user counts followed by either aGROUP BYon that derived count or a windowed approach. Interviewers want to see if you understand grouping on aggregated results, generating missing buckets (optional), and rounding percentages if requested. It’s representative of product-analytics tasks like building engagement histograms.How would HR total regular pay, overtime, and overall compensation per role?
Group the payroll table by
role_title,SUM(regular_salary) AS reg_pay,SUM(overtime_pay) AS ot_pay, and computetotal_comp = reg_pay + ot_pay. Presenting both component and aggregated figures helps budget planning, and comparing each role’s share to company averages can reveal inequities. The paragraph stresses validating that overtime isn’t double-counted and explains how currency conversions or multi-country payrolls complicate roll-ups.What query totals IT, HR, Marketing, and Other departmental spend by 2023 fiscal quarter?
Create
fiscal_qtr = DATE_TRUNC('quarter', txn_date)(or custom fiscal logic), then sum amounts with conditional aggregation:SUM(CASE WHEN dept='IT' THEN amt END) AS it_spend, and group byfiscal_qtr. An “Other” column sums any department not explicitly listed. Finance uses this snapshot to spot over-budget units quickly. Including a quarter index or partition improves performance, and noting how fiscal calendars can differ from calendar quarters shows analyst diligence.
Scenario-Based SQL Questions for Data Analysts (Real Business Use-Cases)
These scenario based SQL interview questions are designed to mirror real-world business situations. Unlike simple SELECT or JOIN practice, these problems test whether you can translate open-ended business requirements into structured SQL queries.
Read more: SQL Case Study Interview Questions and Answers
For experienced analysts, these are the questions that separate strong problem-solvers from surface-level coders.
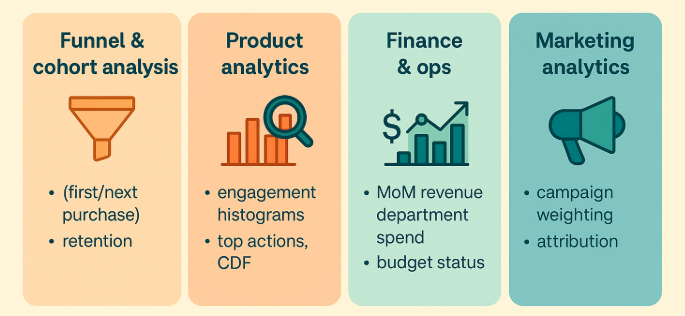
Funnel & cohort analysis (first/next purchase, retention)
Expect questions about identifying the first purchase, calculating repeat purchase rates, or measuring user retention across cohorts. These problems test your ability to use window functions, subqueries, and date comparisons to model customer journeys.
Product analytics (engagement histograms, top actions, CDF)
These questions revolve around product usage metrics: how often users engage, what actions dominate, and how usage distributes. Common techniques include COUNTs, CDF calculations, and histograms via CASE or bucketing.
Finance & ops (MoM revenue, department spend, budget status)
SQL is critical for financial analytics and operational dashboards. You’ll need to compute period-over-period growth, aggregate spending by category, and evaluate whether budgets are on track.
Marketing analytics (campaign weighting, attribution)
Attribution is one of the most business-critical SQL use cases. Expect to allocate conversions across campaigns, measure campaign effectiveness, and compute multi-touch attribution.
Below are 20 SQL scenario based interview questions for data analysts.
Retrieve the third purchase made by each customer
This question tests ranking with ROW_NUMBER. It’s specifically about retrieving the third transaction per customer. To solve this, partition by customer, order by purchase date, and filter where row_number=3. Businesses use this for retention and purchase frequency tracking.
Write a query to find projects where actual spend exceeds budget
This question tests joins and aggregation. It’s specifically about comparing project budgets against actual expenses. To solve this, join budget and spend tables and filter where spend > budget. In practice, this identifies at-risk projects for finance teams.
Find the score closest to a benchmark in SAT results
This question tests ordering and filtering. It’s specifically about finding the score closest to a benchmark. To solve this, compute ABS(score – benchmark), rank by proximity, and return the top result. In education analytics, this is used for admissions matching.
Calculate rolling balances for bank accounts
This question tests running totals. It’s specifically about maintaining a cumulative transaction balance over time. To solve this, use SUM(amount) OVER (PARTITION BY account ORDER BY date). In finance, this underpins fraud monitoring and balance history.
Write a query to detect overlapping subscription periods
This question tests interval joins. It’s specifically about detecting overlapping subscription periods for customers. To solve this, self-join subscriptions where one start_date is within another’s range. Businesses use this for churn and double-billing prevention.
Write a query to sample transactions into weekly time series
This question tests date truncation and bucketing. It’s specifically about aggregating transactions into equal time windows. To solve this, TRUNC(date, ‘week’) or DATE_TRUNC and group counts. In product analytics, this builds weekly active user charts.
Count successful vs failed notification deliveries
This question tests CASE statements. It’s specifically about segmenting successful vs failed notifications. To solve this, SUM(CASE WHEN status=‘success’ THEN 1 ELSE 0 END). In real-world apps, this ensures reliability KPIs for messaging.
Rank search results based on relevance scores
This question tests ranking functions. It’s specifically about ranking results returned for queries. To solve this, partition by query_id and order by relevance score. In practice, this reflects product search quality evaluation.
Write a query to aggregate employee allocations against project budgets
This question tests joins and aggregations. It’s specifically about rolling up employee allocations against budgets. To solve this, join employees to projects and sum allocations by project. In business, this measures resource efficiency.
Calculate the acceptance rate of offers
This question tests conditional aggregation. It’s specifically about computing ratios of accepted offers. To solve this, SUM(CASE WHEN accepted=1 THEN 1 ELSE 0 END)/COUNT(*). In recruiting analytics, this measures hiring funnel efficiency.
This interactive Interview Query dashboard lets you practice real-world SQL interview questions in a live coding environment. You can write, run, and submit queries while getting instant feedback, perfect for mastering scenario-based SQL problems across domains.
Compute month-over-month growth in revenue
This question tests lag functions. It’s specifically about comparing current month totals against the prior month. To solve this, group by month, compute totals, then apply LAG() for comparison. In finance, this powers growth trend dashboards.
Find products that are frequently bought together
This question tests self-joins. It’s specifically about finding product pairs bought together. To solve this, self-join order_items on order_id and group by product combinations. In retail analytics, this drives recommendation engines.
Calculate average order value across customers
This question tests aggregation. It’s specifically about computing total revenue per order and averaging across orders. To solve this, group by order_id, sum revenue, and compute AVG. This is a staple KPI in e-commerce.
List accounts that were closed in a timeframe
This question tests filtering. It’s specifically about identifying accounts marked closed in a timeframe. To solve this, filter accounts where status=‘closed’ and group by closure_date. In banking, this helps monitor churn.
Find shipments completed with related order details
This question tests joins. It’s specifically about identifying shipments marked completed along with order details. To solve this, join orders and shipments tables and filter status=completed. In operations, this supports logistics KPIs.
Sum payments received grouped by type
This question tests aggregation by category. It’s specifically about summing payments by type or source. To solve this, group by payment_type and SUM(amount). In finance analytics, this rolls into revenue dashboards.
Write a query to assign first-touch attribution in campaigns
This question tests window functions and attribution modeling. It’s asked to see if you can assign a conversion to the earliest campaign touchpoint. To solve this, partition by user_id, order by event_time, and filter for ROW_NUMBER()=1. In practice, this models marketing attribution and informs budget allocation.
Write a query to compute swipe precision metrics
This question tests ratios from engagement events. It’s asked to check if you can compute true positives ÷ all swipes. To solve this, filter correct swipes, divide by total swipes. In real-world apps, this measures quality of recommendation systems.
Count second-order likes (liker’s likers)
This question tests recursive joins or self-joins. It’s asked to see if you can count second-order likes (friends of friends). To solve this, join the likes table to itself, matching liker_id to user_id. In production, this models social graph engagement.
Write a query to compute a cumulative distribution function (CDF)
This question tests window functions. It’s asked to see if you can compute running cumulative percentages. To solve this, use SUM() OVER(ORDER BY value)/SUM(total). In practice, this is used for histograms and engagement analysis.
Advanced & Senior-Level SQL: Query Tuning, Indexing, EXPLAIN
At the senior level, interviewers expect you to ship answers that scale. Beyond correct results, you’ll be judged on latency, resource usage, and cost—how you design indexes, avoid full scans, reason about execution plans, and keep pipelines stable as data grows 10×. These are the kinds of advanced SQL interview questions for data analysts that separate day-to-day query writers from engineers who can own production analytics.
Read more: Top 18 Google SQL Interview Questions
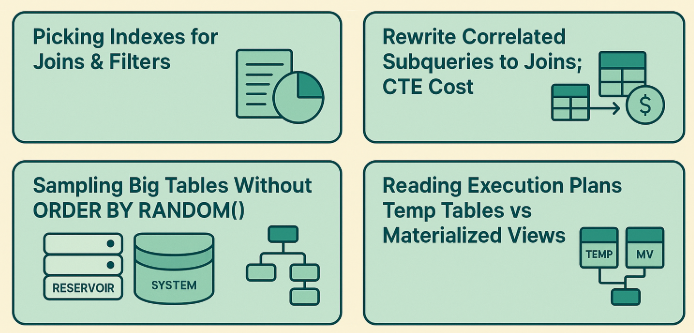
Picking indexes for joins & filters (covering/composite)
High-signal indexes eliminate unnecessary scans. You should know when to add composite indexes (e.g., (user_id, event_time)), pick the leading column based on selectivity and filter patterns, and when covering indexes (including selected columns) prevent lookups. Expect tradeoffs (write overhead, disk) and how to validate wins via EXPLAIN and latency histograms.
Rewrite correlated subqueries to joins; CTE cost
Correlated subqueries often trigger N× scans. Senior candidates rewrite them into JOIN + GROUP BY patterns, fold predicates into WHERE clauses, and use semi/anti-joins for existence checks. Know that some engines inline CTEs while others materialize—so you must test both approaches and validate cost with the optimizer.
Sampling big tables without ORDER BY RANDOM()
ORDER BY RANDOM() is a table-scan footgun. Prefer TABLESAMPLE BERNOULLI/SYSTEM, hashed sampling (e.g., MOD(HASH(id), 100) < 1), or reservoir sampling upstream. The goal is to get unbiased, scalable samples for debugging or exploratory analysis without melting your warehouse.
Reading execution plans; temp tables vs materialized views
You should be fluent in EXPLAIN, spotting Seq Scan vs Index Scan, join strategies (hash/merge/nested), repartitioning/shuffles, and spill risks. Know when to break a monster query into temp tables to pin intermediate results (fast iteration) vs materialized views for persistent, indexed summaries with scheduled refresh.
Watch how a data analyst tackles challenging SQL interview questions in this mock session. This walkthrough highlights practical problem-solving techniques you can apply in your own interview prep.
In this mock SQL interview, Andrew from Data Leap Tech walks through real SQL problem-solving strategies—from filtering logic and joins to handling ambiguous business questions, while demonstrating how clear communication and reasoning can set candidates apart.
Below are some high-difficulty SQL interview questions for data analysts
Compute click-through rates (CTR) across queries
This question tests your ability to design performant queries for search analytics using selective filters, proper join order, and targeted indexes. It’s asked to evaluate whether you can compute click-through rates across query segments while minimizing full scans and avoiding skewed groupings. To solve this, pre-aggregate impressions/clicks by normalized query buckets, ensure a composite index on
(query_norm, event_time)with covering columns for counts, then join safely to deduped clicks; validate withEXPLAINto confirm index usage. In production, this matters because search CTR dashboards must be low-latency and cost-efficient to support experimentation and relevance tuning at scale.Write a query to track how unsubscribes affect login rates over time
This question tests time-series cohorting with window functions, selective predicates, and partition-friendly indexes. It’s asked to see if you can quantify the downstream effect of unsubscribes on logins by cohort/date while keeping scans bounded. To solve this, bucket users by unsubscribe week, compute weekly login rates with
SUM(CASE …)/COUNT(*)andDATE_TRUNC, and back it with(user_id, event_date)indexes; compare plans and materialize intermediate cohorts if needed. In the real world, these insights guide notification fatigue policy and rate limits without burning warehouse credits.Write a query to analyze how user activity influences purchasing behavior
This question tests CTE vs materialization cost and join selectivity when modeling conversion funnels. It’s asked to see if you can compute activity-to-purchase lift without massive shuffles. To solve this, pre-aggregate activity per user/day, materialize to a temp table with indexes on
(user_id, event_date), then join to purchases and compute uplift; compareEXPLAINplans for inline CTE vs temp table strategies. In practice, efficient funnel queries drive marketing and product decisions with timely SLAs.Compute cumulative users added daily with monthly resets
This question tests window framing and partition strategy on large time-series. It’s asked to evaluate if you can compute per-month cumulative counts without rescans. To solve this, use
SUM(1) OVER (PARTITION BY DATE_TRUNC('month', created_at) ORDER BY created_at ROWS BETWEEN UNBOUNDED PRECEDING AND CURRENT ROW)and ensure(created_at)clustering; validate no sort spills. In real-world BI, this feeds monthly growth dashboards with sub-second slices.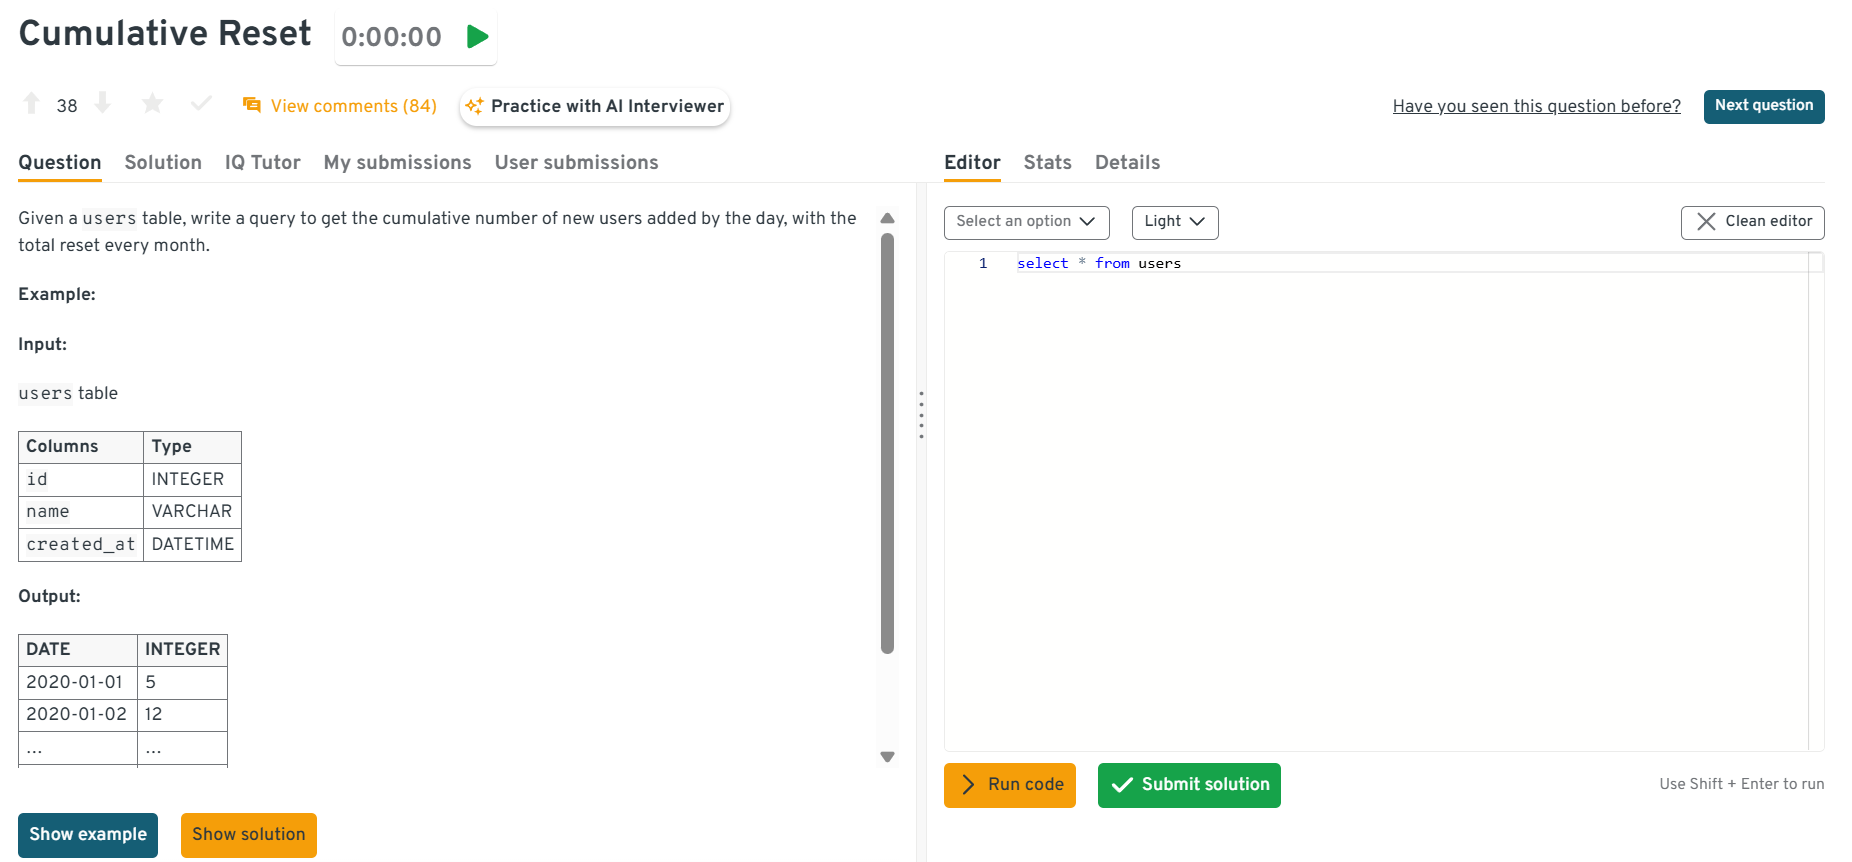
This interactive Interview Query dashboard lets you practice real-world SQL interview questions in a live coding environment. You can write, run, and submit queries while getting instant feedback, perfect for mastering scenario-based SQL problems across domains.
Model notification conversions by type and event
This question tests composite indexing and semi-joins for event funnels. It’s asked to verify you can compute type-level conversion rates without duplicate counting. To solve, dedupe by
(user_id, notification_id)with a covering index, computeview → click → actionusingLEFT JOINchains andNOT EXISTSguards; confirm withEXPLAINthat joins hit the right indexes. In practice, this powers channel attribution and budget allocation.Recommend top users for new friends based on mutuals
This question tests graph-style joins and Top-K with window functions on large social tables. It’s asked to see if you can rank candidates without generating blow-ups from many-to-many joins. To solve, compute per-signal scores with semi-joins, aggregate to a candidate table, index on
(user_id, candidate_id), thenDENSE_RANK()by total score; validate join order viaEXPLAIN. In real products, this is the backbone of people-you-may-know features.Compute average response time to system messages
This question tests self-joins and
LAG()with precise ordering keys and indexes. It’s asked to ensure you can pair system→user events efficiently without whole-table windows. To solve, partition bythread_id, order by timestamp,LAG()to find the previous system msg, compute deltas, and ensure(thread_id, ts)indexing to avoid sorts. In operations analytics, this drives SLA and responsiveness dashboards.Calculate daily minutes in flight per plane
This question tests timestamp arithmetic and grouping. It’s specifically about converting departure/arrival timestamps into minute-level duration per plane and day. To solve this, compute
EXTRACT(EPOCH FROM arrival - departure)/60, group by plane_id and flight_date, and round down fractional minutes; handle overnight flights carefully. In aviation analytics, this supports aircraft utilization dashboards.Return the second-longest flight for each city pair
This question tests ranking within groups. It’s specifically about normalizing city pairs (A-B = B-A), computing durations, and finding the 2nd-longest. To solve this, store sorted city names as
city_a,city_b, compute duration_minutes, then applyROW_NUMBER() OVER (PARTITION BY city_a, city_b ORDER BY duration_minutes DESC)and filter where rank=2. Airlines use this to plan backup aircraft allocations for long-haul routes.Optimize an A/B test query to calculate conversion lift
This question tests experiment analysis with indexing, partitioning, and efficient variance-aware aggregation. It’s asked to see if you can calculate conversion differences between treatment and control groups without scanning the entire dataset repeatedly. To solve this, store users in a single assignment table with
(experiment_id, user_id)keys, index by experiment and date, and compute conversions viaSUM(CASE WHEN converted=1 THEN 1 END)/COUNT(*)grouped by variant. Use window functions or pre-aggregated temp tables to estimate confidence intervals efficiently. In real-world A/B testing, this ensures product teams can run fast, accurate analyses without blowing up compute costs.
Tool-Specific: MySQL, Postgres, BigQuery, SQL Server Differences
When preparing for data analyst interviews, it’s not enough to know “generic SQL.” Employers often use different database engines such as MySQL, PostgreSQL, BigQuery, or SQL Server and each comes with dialect differences that can trip up even experienced analysts.
Read more: How to Use SQL CASE WHEN with Multiple Conditions (MySQL, PostgreSQL, SQL Server, Oracle)
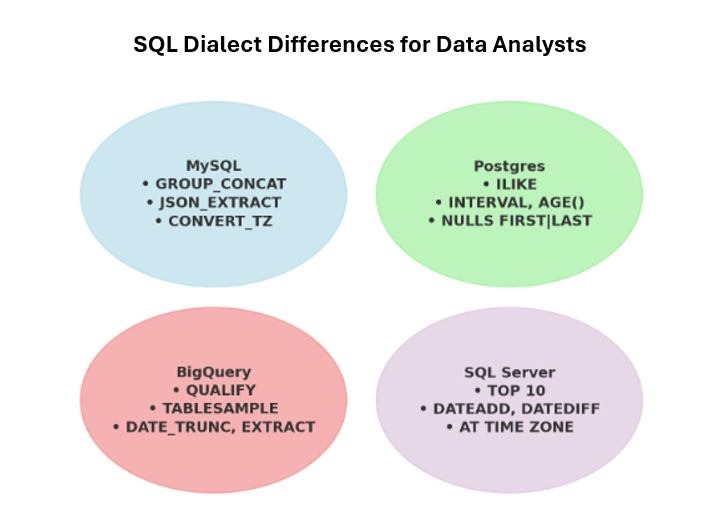
These differences show up in interview questions because they test whether you can adapt queries to the environment at hand. Below are the key points to understand.
Limits, ILIKE vs LIKE, date functions, NULL sort behavior
| Feature | MySQL | Postgres | BigQuery | SQL Server |
|---|---|---|---|---|
| LIMIT syntax | SELECT … LIMIT 10 |
SELECT … LIMIT 10 |
SELECT … LIMIT 10 |
SELECT TOP 10 … or OFFSET … FETCH |
| ILIKE vs LIKE | No ILIKE → use LOWER(col) LIKE |
Supports ILIKE for case-insensitive search |
No ILIKE → use LOWER(col) LIKE |
No ILIKE → use LOWER(col) LIKE |
| Date functions | DATE_ADD, DATE_SUB, STR_TO_DATE |
AGE(), INTERVAL, strong type casting |
DATE_DIFF, DATE_TRUNC, EXTRACT |
DATEADD, DATEDIFF, CONVERT |
| NULL sort behavior | Defaults to NULLS FIRST (ASC) |
Explicit: NULLS FIRST / NULLS LAST |
Similar to Postgres, explicit handling often required | NULLs treated as lowest values by default |
These quirks are subtle but show up in interview questions for data analysts and cross-dialect tasks. Misunderstanding them leads to wrong results in edge cases.
MySQL specifics: GROUP_CONCAT, JSON_EXTRACT, CONVERT_TZ
| Feature | MySQL Example | Equivalent in Other SQL Dialects |
|---|---|---|
| GROUP_CONCAT | GROUP_CONCAT(column)-Concatenates values into a single string per group (e.g., product names per customer). |
-Postgres: STRING_AGG-BigQuery: -SQL Server: |
| JSON_EXTRACT | JSON_EXTRACT(json_col, '$.field')-Query nested JSON fields directly. |
-Postgres: ->, ->>-BigQuery: -SQL Server: |
| CONVERT_TZ | CONVERT_TZ(timestamp, from_tz, to_tz)-Convert between time zones. |
-Postgres: AT TIME ZONE-BigQuery: -SQL Server: |
In interviews, knowing these MySQL-specific functions signals that you can adapt logic to the platform without rewriting entire pipelines.
BigQuery QUALIFY, TABLESAMPLE; SQL Server TOP
| Feature | Syntax Example | Notes |
|---|---|---|
BigQuery QUALIFY |
SELECT user_id, RANK() OVER (PARTITION BY country ORDER BY revenue DESC) as r
|
Filters results after applying window functions. Avoids wrapping queries in subqueries or CTEs (required in Postgres/MySQL/SQL Server). |
BigQuery TABLESAMPLE |
TABLESAMPLE SYSTEM (10 PERCENT) |
Efficiently samples tables for quick testing without full scans. MySQL/Postgres typically use TABLESAMPLE BERNOULLI as a workaround. |
SQL Server TOP |
SELECT TOP 10 column FROM table
|
Uses TOP instead of LIMIT. Supports percentage-based sampling, which is rare in MySQL or Postgres. |
These differences are frequent interview testing points because they reveal if a candidate can recognize dialect-specific syntax and optimize queries for each environment.
Understanding these SQL dialect differences such as limits, case-insensitive search, date arithmetic, NULL ordering, and platform-specific functions will help you ace SQL dialect differences interview questions.
25 Hand-Picked Practice Questions (Copy-Ready Schemas + Answers)
To give you a balanced practice set, here are 25 SQL interview questions split by difficulty:
- 10 Beginner: Foundational filters, joins, and aggregates
- 10 Intermediate: Window functions, subqueries, and time-based logic
- 5 Advanced: Optimization, scaling, and analytical complexity
Each comes with a brief answer and a link to the full solution.
Beginner Level (10): Core Query Building (Filters, Aggregations & Joins)
Focus: mastering SELECT, WHERE, GROUP BY, and basic data joins—the essentials for 80% of SQL interview problems.
1 . Write a query to calculate distance traveled per trip
This question tests arithmetic operations and aggregation. It’s specifically about summing distance covered across multiple trip segments. To solve this, compute SUM(distance) grouped by trip_id. In real analytics, this supports logistics and fleet tracking.
    -- trips_segments(trip_id, segment_id, distance_km)
    SELECT
    trip_id,
    SUM(distance_km) AS total_distance_km
    FROM trips_segments
    GROUP BY trip_id;
2 . Compute session differences per user
This question tests timestamp math. It’s specifically about finding the time between first and last session per user. To solve this, use MIN(session_time) and MAX(session_time) grouped by user_id. This powers session frequency analysis.
    -- sessions(user_id, session_time)
    SELECT
    user_id,
    EXTRACT(EPOCH FROM (MAX(session_time) - MIN(session_time))) / 3600.0 AS hours_between_first_last
    FROM sessions
    GROUP BY user_id;
Practice more: Visit the Interview Query dashboard to practice more such real-world SQL interview questions in a live coding environment.
3 . Detect users with fewer orders than expected
This question tests filtering and HAVING. It’s specifically about finding customers with order counts below a threshold. To solve this, group by user_id and HAVING COUNT(order_id) < threshold. Businesses use this to target reactivation campaigns.
    -- orders(order_id, user_id, created_at)
    WITH counts AS (
    SELECT user_id, COUNT(*) AS order_cnt
    FROM orders
    GROUP BY user_id
    )
    SELECT user_id, order_cnt
    FROM counts
    WHERE order_cnt < 3; -- <-- threshold
4 . Write a query to identify project budget errors
This question tests joins and validation. It’s specifically about mismatched or incorrect budget data. To solve this, join projects and expenses and check inconsistencies. In business, this helps audit finance records.
    -- projects(project_id, budget)
    -- expenses(project_id, amount)
    SELECT
    p.project_id,
    p.budget,
    COALESCE(SUM(e.amount), 0) AS actual_spend
    FROM projects p
    LEFT JOIN expenses e USING (project_id)
    GROUP BY p.project_id, p.budget
    HAVING COALESCE(SUM(e.amount), 0) > p.budget -- over budget
    OR COALESCE(SUM(e.amount), 0) < 0; -- data anomaly guard
5 . Find the average yearly quantity purchased per product
This question tests grouping and aggregation. It’s specifically about averaging annual quantities by product. To solve this, group by product_id and year, compute AVG(quantity). In analytics, this supports forecasting.
    -- order_items(order_id, product_id, quantity, order_date)
    SELECT
    product_id,
    DATE_TRUNC('year', order_date)::date AS year_start,
    AVG(quantity) AS avg_qty_per_order
    FROM order_items
    GROUP BY product_id, DATE_TRUNC('year', order_date)::date
    ORDER BY product_id, year_start;
6 . Write a query to build a like-tracking system
This question tests large-scale aggregations. It’s specifically about tracking likes across users and posts. To solve this, group likes by user_id and post_id, compute counts, and optimize with indexes. In production, this scales social engagement pipelines.
    -- likes(user_id, post_id, created_at)
    SELECT
    post_id,
    COUNT(*) AS like_count,
    COUNT(DISTINCT user_id) AS unique_likers
    FROM likes
    GROUP BY post_id
    ORDER BY like_count DESC;
7 . Write a query to calculate email open rates
This question tests filtering and ratios. It’s specifically about measuring users who opened an email. To solve this, COUNT distinct opens divided by total sends. In marketing, this drives campaign evaluation.
    -- email_events(email_id, user_id, event_type, ts) event_type IN ('sent','open')
    WITH sent AS (
    SELECT email_id, COUNT(DISTINCT user_id) AS sent_cnt
    FROM email_events
    WHERE event_type = 'sent'
    GROUP BY email_id
    ),
    opened AS (
    SELECT email_id, COUNT(DISTINCT user_id) AS open_cnt
    FROM email_events
    WHERE event_type = 'open'
    GROUP BY email_id
    )
    SELECT
    s.email_id,
    open_cnt::decimal / NULLIF(s.sent_cnt,0) AS open_rate
    FROM sent s
    LEFT JOIN opened o USING (email_id);
8 . Find most popular user actions
This question tests ranking functions. It’s specifically about ranking actions by frequency. To solve this, group by action_type, COUNT(*), and rank with RANK(). In BI, this powers feature usage insights.
    -- actions(user_id, action_type, ts)
    WITH counts AS (
    SELECT action_type, COUNT(*) AS action_cnt
    FROM actions
    GROUP BY action_type
    )
    SELECT
    action_type,
    action_cnt,
    RANK() OVER (ORDER BY action_cnt DESC) AS popularity_rank
    FROM counts
    ORDER BY popularity_rank;
9 . Find duplicate customer emails
This question tests grouping and HAVING. It’s specifically about identifying duplicate email addresses in a customer database. To solve this, group by email and filter with HAVING COUNT(*) > 1. In practice, this helps detect data quality issues or fraud.
    -- customers(customer_id, email)
    SELECT
        email,
        COUNT(*) AS dup_count
    FROM customers
    GROUP BY email
    HAVING COUNT(*) > 1;
10 . List customers with no orders
This question tests LEFT JOIN and NULL filtering. It’s specifically about finding users who registered but never made a purchase. To solve this, left join customers to orders and filter where order_id IS NULL. In real analytics, this powers churn and activation analysis.
    -- customers(customer_id, name)
    -- orders(order_id, customer_id, created_at)
    SELECT
        c.customer_id,
        c.name
    FROM customers c
    LEFT JOIN orders o
        ON c.customer_id = o.customer_id
    WHERE o.order_id IS NULL;
Intermediate Level (10): Analytical SQL (Windows, Subqueries & Real-World Patterns)
Focus: translating open-ended business questions into analytical queries using window functions, date bucketing, and complex joins.
1 . Find users who liked and commented on the same post
This question tests joins across multiple activity tables. It’s specifically about intersecting likes and comments. To solve this, join likes to comments on user_id and post_id. In real analytics, this supports engagement funnels.
-- likes(user_id, post_id), comments(user_id, post_id, comment_id)
SELECT DISTINCT l.user_id, l.post_id
FROM likes l
JOIN comments c
ON c.user_id = l.user_id
AND c.post_id = l.post_id;
2 . Write a query to apply attribution rules across campaigns
This question tests CASE logic and joins. It’s specifically about attributing conversions to campaigns. To solve this, join conversions to campaign touches and apply CASE to assign credit. This is common in marketing attribution.
-- touches(user_id, campaign_id, touch_time)
-- conversions(user_id, conversion_time, revenue)
SELECT
t.campaign_id,
COUNT(*) AS convs,
SUM(c.revenue) AS revenue
FROM conversions c
JOIN LATERAL (
SELECT campaign_id
FROM touches t
WHERE t.user_id = c.user_id
AND t.touch_time <= c.conversion_time
ORDER BY t.touch_time ASC
LIMIT 1
) t ON TRUE
GROUP BY t.campaign_id;
3 . Calculate ATM robbery time differences
This question tests TIMESTAMPDIFF. It’s specifically about computing elapsed time between ATM events. To solve this, subtract withdrawal timestamps and filter suspicious patterns. In fraud detection, this identifies anomalies.
-- atm_events(card_id, event_time, event_type, amount)
SELECT
card_id,
event_time AS current_time,
LAG(event_time) OVER (PARTITION BY card_id ORDER BY event_time) AS prev_time,
EXTRACT(EPOCH FROM (event_time - LAG(event_time) OVER (PARTITION BY card_id ORDER BY event_time))) AS seconds_since_prev
FROM atm_events
WHERE event_type = 'withdrawal';
Practice more: Visit the Interview Query dashboard to practice more such real-world SQL interview questions in a live coding environment.
4 . Write a query to detect invalid project pairs
This question tests self-joins. It’s specifically about identifying conflicting project assignments. To solve this, self-join project assignments and filter overlapping records. This ensures integrity in resource planning.
-- assignments(emp_id, project_id, start_date, end_date)
SELECT
a.emp_id, a.project_id AS proj_a, b.project_id AS proj_b
FROM assignments a
JOIN assignments b
ON a.emp_id = b.emp_id
AND a.project_id < b.project_id
AND a.start_date <= b.end_date
AND b.start_date <= a.end_date; -- overlap
5 . Retrieve each user’s last transaction
This question tests window functions. It’s specifically about finding the most recent transaction per user. To solve this, partition by user_id, order by date desc, and pick ROW_NUMBER=1. In practice, this supports recency tracking.
-- transactions(txn_id, user_id, amount, txn_time)
SELECT user_id, txn_id, amount, txn_time
FROM (
SELECT t.*,
ROW_NUMBER() OVER (PARTITION BY user_id ORDER BY txn_time DESC) AS rn
FROM transactions t
) s
WHERE rn = 1;
6 . Write a query to detect repeat job postings
This question tests filtering and de-duplication. It’s specifically about finding identical job titles/companies posted multiple times. To solve this, group by job_title and company_id and use HAVING COUNT(*) > 1. Businesses use this for quality control in job boards.
-- jobs(job_posting_id, company_id, job_title, posted_at)
SELECT company_id, job_title, COUNT(*) AS postings
FROM jobs
GROUP BY company_id, job_title
HAVING COUNT(*) > 1
ORDER BY postings DESC;
7 . Write a query to aggregate customer orders
This question tests joins and SUM. It’s specifically about calculating total spend per customer. To solve this, join customers to orders and SUM(amount) grouped by customer_id. Businesses use this for CLV reporting.
-- customers(customer_id), orders(order_id, customer_id, amount)
SELECT
c.customer_id,
COALESCE(SUM(o.amount), 0) AS total_spend
FROM customers c
LEFT JOIN orders o USING (customer_id)
GROUP BY c.customer_id
ORDER BY total_spend DESC;
8 . Generate a monthly customer report
This question tests date truncation and grouping. It’s specifically about counting customers or spend per month. To solve this, use DATE_TRUNC('month', created_at) and group counts or sums. This feeds executive dashboards.
-- customers(customer_id, created_at)
SELECT
DATE_TRUNC('month', created_at)::date AS month_start,
COUNT(*) AS new_customers
FROM customers
GROUP BY month_start
ORDER BY month_start;
9 . Find the longest user streaks
This question tests window functions. It’s specifically about identifying consecutive active days per user. To solve this, use ROW_NUMBER differences grouped by user_id. In apps, this supports retention tracking.
-- logins(user_id, login_date::date)
WITH days AS (
SELECT user_id, login_date::date AS d
FROM logins
GROUP BY user_id, login_date::date
),
grp AS (
SELECT
user_id, d,
d - ROW_NUMBER() OVER (PARTITION BY user_id ORDER BY d)::int * INTERVAL '1 day' AS grp_key
FROM days
)
SELECT user_id, MIN(d) AS streak_start, MAX(d) AS streak_end,
COUNT(*) AS streak_len
FROM grp
GROUP BY user_id, grp_key
ORDER BY streak_len DESC;
10 . Calculate 7-day user streaks
This question tests date logic. It’s specifically about detecting sequences of 7 consecutive active days. To solve this, use DATE_DIFF between min and max consecutive logins with ROW_NUMBER. This measures user engagement intensity.
-- logins(user_id, login_date::date)
WITH days AS (
SELECT DISTINCT user_id, login_date::date AS d
FROM logins
),
grp AS (
SELECT
user_id, d,
d - ROW_NUMBER() OVER (PARTITION BY user_id ORDER BY d)::int * INTERVAL '1 day' AS grp_key
FROM days
)
SELECT user_id
FROM (
SELECT user_id, grp_key, COUNT(*) AS cnt
FROM grp
GROUP BY user_id, grp_key
) s
WHERE cnt >= 7;
Advanced Level (5): Scalable & Analytical SQL (Cohorts, Retention & Optimization)
Focus: cohort analysis, A/B testing, and multi-step queries that simulate production-level analytics pipelines.
1 . Write a query to track flights and related metrics
This question tests grouping and ordering. It’s specifically about summarizing flights per plane or route. To solve this, group by plane_id or city pair and COUNT/AVG durations. This supports airline operations dashboards.
-- flights(flight_id, plane_id, origin, desHow to Prepare in 7–14 Days (Study Plan + Checklist)
Whether you’re prepping for your first job or have years of experience, cracking the SQL portion of a data analyst interview requires more than just memorizing syntax, you need to solve business problems using structured logic, write efficient queries, and explain your reasoning clearly.
This accelerated plan assumes you already have solid SQL fundamentals. If you’re still building basics, spend an extra 1–2 weeks on foundations before attempting this sprint.
| Days | Focus Area | What to Practice |
|---|---|---|
| Day 1–3 | Refresh joins/aggregations | - Inner, left, right, self joins (avoid duplicates/data loss) - GROUP BY with COUNT(), SUM(), AVG(), MIN(), MAX() - HAVING vs WHERE - Small datasets first, then real interview-style questions |
| Day 4–7 | Windows & scenarios | - ROW_NUMBER(), RANK(), DENSE_RANK() (differences in tie handling) - Running totals, moving averages, LAG()/LEAD() - Funnel analysis, retention, customer ranking - Subqueries and CTEs for layered transformations |
| Day 8–10 | Optimization drills + mock tests | - Indexes and spotting full scans - Rewrite correlated subqueries into JOINs - Sampling large tables without ORDER BY RANDOM() - Take at least two timed mock SQL tests |
| Day 11–14 | Company-specific dry runs | - Research company stack (MySQL, Postgres, BigQuery, SQL Server) - Review past interview experiences or case studies - Run dry runs on realistic datasets (e-commerce, SaaS, marketing funnels) - Practice explaining queries out loud |
With this 14-day plan, you’ll cover all the essential SQL topics for data analyst interviews, from joins and windows to optimization and company-specific nuances, while also building the confidence to explain your reasoning clearly.
FAQs
What SQL questions are asked in a data analyst interview?
Expect fundamentals like joins, aggregations, and filtering, along with window functions such as ranking, running totals, and moving averages. You’ll also see subqueries/CTEs, date bucketing, and at least one or two scenario-style problems (e.g., cohort analysis, funnels, month-over-month revenue). For senior-level roles, interviews often include indexing, execution plans, and query tuning.
Is SQL enough to get a data analyst job?
SQL is essential but not enough on its own. You’ll also need proficiency in BI tools (Tableau, Power BI, Excel), basic statistics (A/B testing, correlation), and communication skills to explain insights clearly. SQL gets you shortlisted and business acumen gets you hired.
How many SQL questions should I expect in a screen, and which SQL platform is most used by data analysts?
You’ll face around 3–6 SQL questions in a 30–60 minute round—typically a mix of basic joins, aggregations, intermediate window functions, and one scenario-based problem. Onsite or second rounds may add a take-home assignment or a longer whiteboard-style session.
PostgreSQL and MySQL are the most common for analysts, while BigQuery and Redshift dominate cloud teams. Core SQL skills transfer across all dialects.
What is the quickest way to learn SQL for data analyst interview?
If you’re short on time, focus on core patterns: joins, GROUP BY, and window functions. Solve 10–15 practice problems daily, simulate time pressure, and use EXPLAIN to understand performance. Prioritize realistic business questions like funnels, cohorts, and revenue tracking.
What are the required skills to crack a data analyst interview?
To crack a data analyst interview, you need a blend of technical and analytical skills. Core technical skills include SQL for querying and data manipulation, Python or R for deeper statistical analysis, and BI tools like Tableau, Power BI, or Looker for data visualization. Analytical thinking, problem-solving, and business understanding are just as crucial—employers value candidates who can translate raw data into actionable insights. A solid grasp of Excel, statistics, and communication skills to present findings clearly rounds out the must-have skill set.
What does a data analyst do?
A data analyst collects, processes, and interprets data to help businesses make informed decisions. Their day-to-day work includes cleaning and transforming datasets, writing SQL queries to extract relevant information, building dashboards, and identifying patterns or trends that inform business strategy. Analysts often collaborate with engineers, data scientists, and product managers to monitor KPIs, optimize performance, and provide data-backed recommendations. Essentially, they turn raw data into meaningful stories that guide strategic and operational decisions.
How to answer “Why should we hire you as data analyst?”
A strong answer should connect your technical skills to business impact. Emphasize how your SQL proficiency, analytical thinking, and problem-solving ability make you capable of turning complex datasets into actionable insights. For example, you could say:
“You should hire me because I combine strong SQL and data visualization skills with a business-oriented mindset. I’ve worked on projects where I transformed raw data into insightful reports that helped leadership identify key growth drivers. I’m confident I can bring the same analytical clarity and results-driven approach to your team.”
Keep it specific, impact-oriented, and aligned with the company’s analytics goals.
Mastering SQL isn’t just about passing interviews, it’s about thinking like an analyst. The best candidates go beyond syntax: they explain trade-offs, spot edge cases, and tie every query back to a business question.
By working through these categorized questions and practicing in a live environment, you’ll gain the confidence to tackle any SQL challenge, from cohort analysis to query optimization with clarity and precision.
Keep writing queries, reviewing execution plans, and timing yourself under real-world conditions. The more you practice, the more second-nature SQL becomes, turning interview questions into conversations about how you think, not just what you can code.
Related Roles & Next Steps
SQL isn’t just tested for data analyst interviews, but shows up across analytics and engineering roles. If you’re broadening your prep, here’s how SQL applies in adjacent paths:
- Data Analyst: Core role focused on joins, aggregations, and scenario-based reporting.
- Business Analyst (SQL): Emphasizes SQL for KPIs, dashboards, and stakeholder-facing queries.
- Data Engineer (SQL): Adds complexity with query tuning, ETL pipelines, and warehouse optimization.
- Data Science (SQL): Focuses on SQL for sampling, feature extraction, and experiment design.
These guides prepare you for data analyst SQL interview questions as well as SQL questions for business analysts, data engineers, and data scientists, giving you broader career flexibility.
Practice Next
You can only get good at SQL by writing queries in realistic environments. Here’s where to sharpen your skills before interviews:
Struggling with tricky CASE WHEN logic or GROUP BY filters? Master them with our step-by-step SQL Learning Path to go from basic joins to advanced optimization. Then simulate the real pressure using Mock Interviews.
Struggling with take-home assignments? Get structured practice with Interview Query’s Take-Home Test Prep and learn how to ace real case studies.
Interviewing at Meta, Amazon, or Stripe? Use our curated company specific guides (Meta SQL Guide, Amazon SQL Questions, Stripe Interview Questions) to prep like the pros.
Consistent practice across these resources will prepare you for SQL interview questions for data analyst roles, whether it’s a take-home, live coding screen, or whiteboard session.