Sports Analytics Projects: A Comprehensive Guide for 2025

Overview
Sports analytics has emerged as one of the fastest-growing segments in the Big Data industry, experiencing a 27% growth over the past decade, according to the Bureau of Labor Statistics. This field has revolutionized how teams make decisions, on and off the field, using statistical analysis, quantitative methods, and predictive forecasting.
The sports analytics concept gained mainstream popularity through “Moneyball,” which showcased how the Oakland Athletics leveraged analytics to reach the playoffs despite budget constraints. Today, completing a sports analytics project is essential for gaining recognition and hands-on experience in this competitive field.
Types of Sports Analytics Projects
Most sports data science projects fall into four main categories:
- Predicting outcomes: Projects that forecast player or team performance to determine game results or point spreads.
- Competitor valuation: Analyses that assess a player’s impact or a team’s strength relative to competitors.
- Identifying problem areas: Projects that pinpoint areas where players or teams can improve, such as analyzing free throw percentages and their impact on wins.
- Analyzing game strategies: Studies that examine trends in gameplay, strategies, or styles of play, like evaluating the effectiveness of the 2-for-1 play in basketball.
MLB Sports Analytics and Sports Statistics Projects
Almost all MLB baseball teams employ data scientists and statisticians to predict player performance and gain a competitive edge. Baseball analytics projects typically examine performance or gauge the valuation of a team or player. Here are some MLB analytics projects you can try:
1. Swish Analytics Take-Home: Pitch Predictions

This sports analytics take-home from Swish Analytics is more of a shorter data challenge. You’re provided with a table of the pitches from the 2011 MLB season and metadata. And your goal is to build a model to predict the probability of a fastball, slider, curveball, etc.
This take-home challenge requires about 3-5 hours to complete, and it’s used as part of the interview process at Swish Analytics. Ultimately, the challenge asks you to build and evaluate a model that could be used in a production environment, including data analysis, feature engineering, and code assembly.
2. Gauging When Players Peak

This guided baseball analytics project is excellent for beginners. Using MATLAB, the project walks you through importing baseball data, calculating batting statistics, creating visualizations, and analyzing player careers.
Thanks to the step-by-step tutorial, this project provides a solid introduction to MLB stats analysis, and you’ll be able to answer the questions: What defines a great MLB hitter? And at what point do great hitters peak in their careers? If you want to re-create the project, use data from Baseball-Reference.
3. HOF Analysis with Random Forests

This project delves deep into understanding the factors that may influence a baseball player’s induction into the Hall of Fame. Using random forests and local importance scores offers a quantitative approach to what has often been a subject of speculation.
To begin, fetch the data from the Lahman package and address any missing values during data collection and cleaning. To create a comprehensive view, integrate multiple datasets, merging batting statistics, fielding statistics, and awards. During modeling, random forests will be utilized for classification without splitting the data, allowing you to explore its entirety. The local importance scores will be especially useful in identifying the most significant variables for this classification.
In your analysis and interpretation, examine the importance of these variables and contrast them across different classes. A deep dive into outliers will further enhance your understanding, providing nuanced insights into the dataset.
4. Predicting World Series Winners
This project comes from the Baseball Data Science blog, which attempts to answer a classic pre-season sports analytics question: Which team will most likely win it all?
This project uses tree-based models to determine top teams, and after training, it proved reasonably successful. For example, of the Top 5 teams predicted to be World Series winners in 2020, four teams made deep playoff runs, with the No. 2 team (Dodgers, 25%) winning it all.
Another source: See FiveThirtyEight’s MLB ELO ratings and read about how their MLB predictions work.
5. Predicting Pitcher Saves

This project - which you can see in a step-by-step tutorial here - attempts to forecast which MLB pitcher will have the most saves at the beginning of the season.
Using BeautifulSoup to scrape Baseball-Reference data, the author, Ethan Feldman, starts with a simple regression model, which just used the previous season’s saves as the only feature.
Ultimately, the project is difficult as there is significant variability in the number of saves, making this an excellent project for further model testing and development.
NBA Sports Analytics and Sports Statistics Projects
There are numerous NBA sports analytics projects and questions you can explore. See the top NBA articles on Towards Data Science if you’re looking for inspiration. Or you can follow along with these basketball analytics projects and datasets and create your own:
6. Predicting NBA MVPs

Predicting player performance is a common subject of sports analytics projects, and this one attempts to use machine learning to determine the most likely player to win the MVP award.
You can follow a tutorial, which will show you how to import data and apply various machine learning models, including linear regression, random forests, and XGBoost.
The models presented in this tutorial correctly predicted the 2021-22 MVP winner Nikola Jokic and the other Top 3 spots (however, the No. 3 prediction was No. 2 in the actual MVP race).
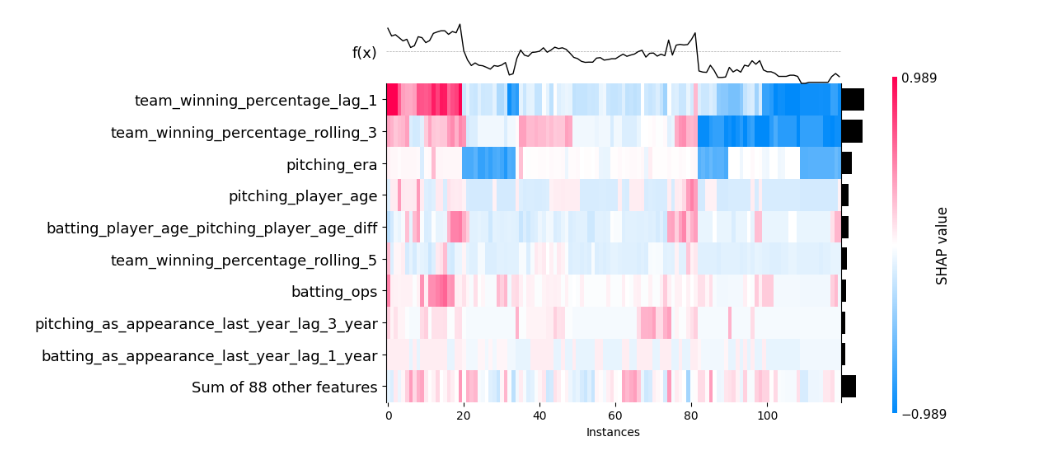
7. Predicting NBA Salaries

By leveraging data-driven insights to understand NBA player salaries, we can enhance league competitiveness and provide teams with a more accurate valuation of players. This leads to a smarter and more strategic signing.
In this project, we will delve into NBA salaries, focusing on data from the 2020-21 season onwards and particularly on Free Agents (FAs). The aim is to predict future salaries, reflecting a player’s worth on the court.
To get started, source your data using BRScraper from Basketball Reference. Next, prevailing trends are analyzed, and regression models, including Random Forest and Gradient Boosting, are applied. To assess the results, lean on metrics like RMSE and R². Finally, delve into SHAP values to truly understand the key factors determining salaries. The end goal is to equip teams with the insights needed for well-informed contractual decisions.
8. NBA Draft Success Analysis

Drafting NBA players is an inexact science; however, some NBA franchises are more successful than others. For example, the Sacramento Kings have a poor draft record, which is one reason the franchise has missed the playoffs for 16 consecutive seasons.
This tutorial walks you through determining draft rankings based on player performance, draft position, and other factors.
9. Predicting Double-Doubles

Predicting a double-double based on the number of games played by a player, the number of games played in a season, and other variables is challenging. But this project attempts to predict if one player, Nikola Vučević, will score a double-double in any game.
You can follow this tutorial to build a regression model in R to make such a prediction. Ultimately, the model correctly predicts double-doubles 61% of the time. Enrich the dataset and see if you can improve the model’s accuracy.
10. Simulating NBA Games in Python

This tutorial from Ken Jee evaluates game win probability based on team points scored and team points against.
You’ll find a variety of sports analytics datasets on Jee’s site you can use. One option: This straightforward model uses only the team’s historical average. That’s why it’s an excellent project for beginners.
If you wanted to take this project further, you could incorporate historical player data to enrich the model.
Fantasy Sports Analytics Projects
Data science can be used in fantasy sports to give your team a competitive advantage. In particular, most fantasy sports analytics projects look at line-up and draft optimization, as well as predicting player performance. Here are some projects to try to improve your fantasy sports teams:
11. DraftKings Data Analytics Take-Home
Although this isn’t a project per se, DraftKings analytics take-home it will help you practice skills and prepare for a sports analytics interview. This challenge is broken down into three parts:
1) A data sense test - You’re asked: describe what you see in the chart above. 2) A SQL challenge - Writing SQL queries to pull fantasy sports metrics. 3) A Python challenge - A quick test of your applied programming skills.
Many analyst roles at fantasy sports companies require take-homes like this. However, this is also a short practice assignment for SQL and sports analytics.
12. Optimizing Your Fantasy Line-Up
Here’s an approach to daily fantasy football strategy. Build a model to value players based on a “cost per point” metric. This model essentially values players by their predicted points divided by their latest salary cost. However, the next step is determining optimal line-up, and the author walks through two options: Random Walk or Integer Linear Programming to determine the best line-up combination for your team. Here’s another look at using Linear Programming for fantasy football optimization.
13. Winning English Premier League Fantasy
Bias and player favoritism affect team performance in English Premier League fantasy. Players tend to pick their favorites, and not necessarily footballers with the best ROI. This tutorial shows you how to build an algorithm in Python to pick the best team, consisting of players with the best ROI.
14. Forecasting Performance Based on Defense
Does the strength of a defense affect a player’s performance in NFL fantasy football? This fantasy football project found a slight correlation, e.g. when a player plays against a better defense their production tends to go down. Another option: You can take this a step further and gauge performance against individual defensive players. For example, you could determine wide receiver performance against a top cornerback, or quarterback performance against a top pass rusher.
General Sports Data Science Projects
There’s an endless variety of sports analytics projects you can try. Here are some ideas for performing geographic clustering, predictions with random forests, and creating play-by-play visualizations with NFL data.
15. Realigning Divisions with Machine Learning
Professional sports teams are put into divisions that aren’t always geographically efficient. For example, the Dallas Cowboys play in the NFC East, along with teams in New York, Pennsylvania, and Washington DC. Using a clustering algorithm, you can build a model to realign teams based on geographic distance. This tutorial shows you how to use a K-means algorithm to minimize travel distance between teams. Ultimately, you can apply this technique to a variety of geographic clustering problems.
16. Plotting NFL Play-by-Play Data in Python
Check out this tutorial for using the Python package nfl_data_py to ingest NFL play-by-play data to build visualizations. The tutorial walks you through plotting passing yards by quarterbacks throughout the 2021-22 NFL season. However, you can adapt this project to perform a variety of analyses. You’ll find some ideas for questions you can analyze in NFL data analytics projects here like how defensive statistics affect points allowed, or analyzing how quarterback play has changed historically.
17. Predicting World Cup Game Winners
With the 2022 World Cup right around the corner, this sports machine learning project is super relevant. In 2018, researchers tested three models for predicting World Cup winners: Poisson regression, random forest, and ranking methods. Ultimately, using a random forest model, they simulated the World Cup 100,000 times, using FIFA rating, average team age, and player ability as the most important variables. The model performed moderately well, predicting 11 of the Round of 16 teams correctly. The model predicted Germany would win it all; however, Germany lost in the Group Stage. Also, check out this article on simulating the 2022 World Cup for more ideas.
18. How Golf Drives Affect Scoring
What’s the better approach: Long drives that are crooked or shorter, more accurate drives? Ken Jee took a look at this question to see which approach had a stronger effect on points. See his video for more explanation about this project.
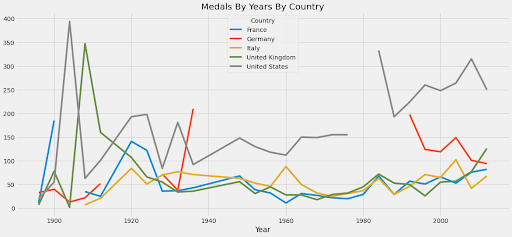
19. Olympic Medals Analysis
This is a great dataset for a sports analytics project. Featuring 35,000 medals awarded since 1896, there is plenty of data to analyze, and it’s useful for identifying performance trends by country and sport. Here’s a visualization from Didem Erkan
20. Home Field Advantage Analysis
Does home-field advantage matter in the NFL? Can you quantify how much it matters? First, gather data from Pro-Football-Reference.com. Then, you can perform a simple linear regression model to measure the impact.
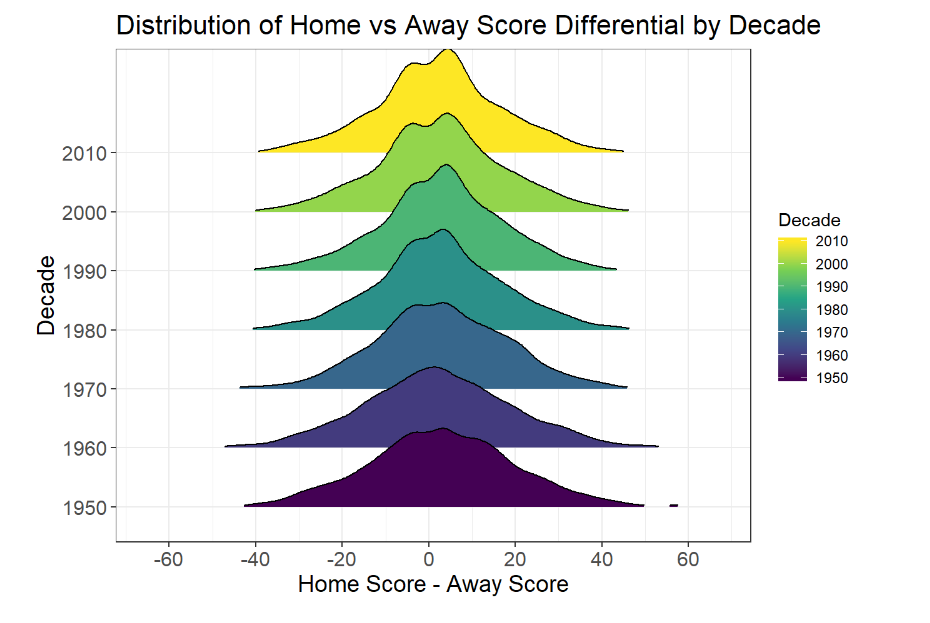
There are a ton of projects you can do with NFL data. One would be to determine WR rankings, based on season performance.
21. International Football Results from 1872 to 2025
This dataset on international football matchesprovides an extensive compilation of football matches over a span of more than 150 years. For any football enthusiast, this is a goldmine of data waiting to be uncovered.
To start with the analysis, begin with data cleaning and pre-processing. Even though the dataset appears comprehensive, it’s vital to ensure it lacks missing values, inconsistencies, or duplicates. Doing so greatly refines the precision of the insights that will be derived. After cleaning the data, dive into EDA using histograms, then transition to Temporal Analysis for historical trends.
You can also study a specific nation’s metrics over time or identify historical rivalries by analyzing performance against specific countries for deeper insights.
22. F1 Performance Analysis
Formula 1 is a sport that’s as much about strategy and data as it is about speed. With races determined by split-second decisions, the information provided in this dataset can offer invaluable insights into the performance of each F1 racers over the season.
First, ensure that all datasets are consistent, error-free, and interlinked correctly. Perform an EDA to visualize metrics such as the racers’ wins, podium finishes, and other pivotal performance metrics.
For a more challenging take, you could also analyze a racer’s performance over tracks and identify which tracks they perform best.
23. Are sports supplements effective?
Athletes and enthusiasts use supplements to improve their overall performance in sports. This dataset bridges the gap between claims of effectiveness and scientific validation.
An Exploratory Data Analysis (EDA) will reveal which legal supplements truly enhance performance, endurance, and strength according to rigorous scientific scrutiny.
24. Toughest Skill in Terms of Sports
Are you wondering which sport is truly the hardest?
This dataset offers a unique perspective by evaluating sports based on various skills. Through detailed analysis, it seeks to quantify the complexity and challenge of different sports, providing data-driven insights into this decades-long discussion.
Updated Projects for 2025
Tennis Grand Slam Performance Prediction
Dataset: ATP and WTA Professional Tennis Match Data (2007-2021)
Project Goal: Predict player performance in Grand Slam tournaments based on surface-specific statistics, recent form, and head-to-head matchups.
Techniques: Time series analysis, ensemble learning, and feature engineering focusing on surface-specific performance metrics.
Olympic Medal Prediction for Paris 2024
Dataset: 120 Years of Olympic History
Project Goal: Build a model to predict medal counts by country for the Paris 2024 Olympics.
Techniques: Regression analysis with country-specific features including economic indicators, past Olympic performances, and current world rankings in various sports.
E-Sports Player Performance Analysis
Dataset: League of Legends Esports Player Game Data (2019-2024)
Project Goal: Analyze factors contributing to professional player longevity and performance consistency.
Techniques: Longitudinal data analysis, clustering of player styles, and identification of performance indicators that predict career longevity.
Women’s Sports Viewership Prediction
Dataset: Use data from sources like the Women’s Sport Trust and Futures Sport & Entertainment mentioned in the Marketing Week article.
Project Goal: Identify factors driving increased viewership and develop a model to predict future growth.
Techniques: Multivariate regression, sentiment analysis of social media data, and time series forecasting.
Injury Risk Prediction in Professional Athletes
Dataset: Use PlayerData’s Workload Metric as a starting point.
Project Goal: Develop an early warning system to identify athletes at elevated risk of injury.
Techniques: Survival analysis, anomaly detection, and physiological load modeling using metrics such as volume, intensity, and workload.
Related: Explore additional Data Analytics Project Ideas and Datasets
More Data Analytics Projects to Try
Suppose you’re looking for more projects to build your data science portfolio and present your data science project; look at our list of data analytics projects, which feature more general tasks. You might also try a data science project from our list of 30 ideas and datasets or a Python data science project.