

Google Business Analyst Interview Questions & Preparation Guide (2026)


Introduction: Why Business Analysis Matters at Google
Behind every Google product, from Search to YouTube, is a team of analysts turning data into decisions. Google’s business analysts don’t just crunch numbers; they shape strategy, guide marketing, and influence billion-user products.
The role blends technical skill (SQL, dashboards, data modeling) with business judgment (problem framing, stakeholder alignment, data storytelling). The interviews test both, from writing queries to defining success metrics.
This guide covers everything you need to ace the Google business analyst interview, technicals, behaviorals, prep tips, and salary insights, so you can walk in ready to nail the interview.
What Does a Google Business Analyst Do?
A business analyst at Google is the bridge between data, strategy, and decision-making. Whether it’s helping YouTube’s product team understand viewer retention, or optimizing ad performance for Google Cloud customers, analysts shape how Google grows.
While responsibilities vary by team (Ads, Cloud, Finance, or Product Analytics), here’s what most Google Business Analysts do day-to-day:
- Collect and analyze data from multiple sources (BigQuery, Google Analytics, internal dashboards) to uncover insights.
- Design metrics and KPIs that measure business and product performance accurately.
- Build dashboards and reports using tools like Tableau, Looker, and Data Studio for senior leadership.
- Collaborate with cross-functional teams, including engineers, data scientists, PMs, and marketing analysts, to guide data-driven decisions.
- Identify process improvements and automate recurring reporting tasks using SQL and Python.
- Translate business questions into analytical problems and communicate findings clearly to both technical and non-technical audiences.
Why this role at Google
Business analysts sit at the heart of Google’s data-driven culture. They ensure decisions are backed by evidence, not assumptions, and their analyses often influence billion-dollar product strategies. If you enjoy connecting data to real-world business impact, this role lets you do exactly that on a global scale.
Google Business Analyst Interview Process: Step-by-Step Breakdown
The Google business analyst interview goes far beyond testing technical ability. It’s built to evaluate how you think, how you communicate insights, and how you connect data to real business impact. You’ll need to demonstrate structured reasoning, strong analytical intuition, and the ability to collaborate across diverse teams, from product managers to data scientists and operations leaders.
The process typically spans four to six stages, depending on the team and location, and takes about four to six weeks from first contact to final offer. Each stage during the Google interview builds on the last, moving from general background screening to deep technical and problem-solving evaluations.
Initial Recruiter Phone Screen
Your journey starts with a 30–45-minute conversation with a Google recruiter. The focus here is alignment—does your background match the team’s analytical and business needs?
Expect questions about:
- Your analytical background and experience with tools like SQL, Tableau, or Looker.
- Projects where you influenced business or product decisions using data.
- Understanding of Google’s mission and products.
Recruiters will also ask about team preferences (Ads, Cloud, YouTube, etc.), location, and timeline availability.
Tip: Treat this as a dialogue, not a test. Show curiosity about Google’s analytics culture and back up your answers with measurable outcomes. For example: “I helped reduce churn by 8% by building retention dashboards in Tableau that identified at-risk customer segments.” This signals that you understand both data and its business implications.
Technical Interviews (SQL, Analytics & Statistics)
Once you clear the recruiter round, you’ll move to one or two technical interviews, typically conducted by current analysts or data scientists. Each lasts about 45–60 minutes and focuses on how you approach problems from first principles.
You’ll be tested on:
- SQL proficiency: writing efficient queries, performing joins, aggregations, and analytical functions (window functions, subqueries).
- Data interpretation: explaining insights drawn from raw tables or dashboards.
- Statistical reasoning: applying concepts like confidence intervals, hypothesis testing, or A/B testing to real business scenarios.
You might also face product-centric prompts such as:
“How would you measure the success of a new Google Ads feature for small businesses?”
Tip: Don’t rush to code. Think aloud, outline your plan, and explain your assumptions. Google values clarity, logic, and collaboration as much as correct syntax.
Case Study & Scenario-Based Interviews
This is where Google tests your ability to apply analytics in real-world contexts. The case study or business scenario interview simulates a day in the life of a Business Analyst.
You might be given a dataset, a business problem, or an open-ended question like:
“Engagement on Google Maps reviews has dropped by 10%. How would you diagnose the issue and present your findings?”
You’ll need to:
- Clarify the business question and its context.
- Identify key metrics and data sources.
- Propose a structured analysis approach.
- Communicate insights with actionable recommendations.
In some cases, you may also get a take-home case where you build a dashboard, summarize insights, or craft a business report.
Tip: Use a structured framework, for instance: Clarify → Explore → Analyze → Recommend. End by summarizing how your findings would guide a decision.
Behavioral & Leadership Interviews (Googliness)
Behavioral interviews assess how you operate in ambiguity, collaborate with others, and embody Google’s values. The goal is to understand how you think under pressure, take initiative, and influence decisions through data.
Expect scenario-based prompts like:
- “Tell me about a time you challenged a stakeholder’s assumption using data.”
- “Describe a situation where you didn’t have complete information but still had to make a recommendation.”
Use the STAR method (Situation, Task, Action, Result) to structure your answers, and make sure each story demonstrates impact, teamwork, and reflection.
Tip: Keep your examples outcome-focused. For instance: “After identifying reporting inefficiencies, I automated data pulls in SQL, saving the team 12 hours a week, which allowed more time for insight generation.”, which shows leadership, ownership, and analytical initiative, which are three qualities Google prizes highly.
Onsite (or Virtual Final) Interviews
This stage combines all elements from technical, strategic, and interpersonal, into a comprehensive evaluation loop of 4–5 rounds. You’ll meet analysts, PMs, and hiring managers from cross-functional teams.
Each round usually covers:
- SQL and Data Manipulation – Evaluate efficiency, accuracy, and scalability of your queries.
- Statistics and Experimentation – Apply analytical thinking to product or business questions.
- Business Acumen / Product Sense – Translate data into clear business insights and prioritize metrics.
- Behavioral and Collaboration – Demonstrate adaptability, communication, and teamwork.
- Cross-Functional Case Discussion – Present how you’d explain technical findings to executives or non-technical stakeholders.
Tip: Think aloud. When you get stuck, narrate your reasoning. Google wants to see your analytical thought process, not just the final answer.
Hiring Committee & Team Matching
Once all interviews are complete, your feedback goes to a Hiring Committee, which is a group of senior Googlers who review candidates holistically to maintain consistent standards across roles.
If approved, you enter Team Matching, where managers from different product areas (Ads, Cloud, YouTube, Finance, etc.) review your profile and request to meet you. You’ll discuss the team’s goals, data challenges, and how your skills align with their mission.
Tip: Treat this as a two-way conversation. Ask about key business metrics, analytical tools used, and how success is measured on their team. Showing curiosity and business understanding helps position you as both technically strong and strategically aligned.
Google Business Analyst Interview Questions
Google’s business analyst interviews blend technical depth with business intuition. You’ll be expected to pull insights from data, connect them to strategy, and explain them clearly to both technical and non-technical stakeholders. The best candidates think beyond SQL—they tell stories with numbers and communicate decisions with confidence.
Below are the key categories of questions you’ll encounter, complete with sample answers and tips to help you prepare like a pro.
Read more: Business Analyst Interview Questions: A Comprehensive Guide
SQL & Technical Interview Questions
SQL questions at Google test whether you can reason about data, not just write syntax. Interviewers want to see clean logic, scalability, and an understanding of data quality, all while keeping business goals in mind.
Sample every 4th row ordered by the date.
This question tests date bucketing and aggregation. It’s specifically about sampling transactions into uniform time buckets. To solve this, truncate dates to day/week, group, and count. In practice, this powers dashboards with time-based KPIs.
Tip: Mention how you’d validate your sample to ensure it accurately represents the full dataset.
Get the top five most expensive projects by budget to employee count ratio.
This question tests joins and aggregations. It’s specifically about summing employee allocations against project budgets. To solve this, join employee assignments to projects and aggregate. In practice, this helps track resourcing efficiency.
Tip: Explain how outliers or incomplete data could distort ratios and how you’d adjust for them.
Find the month_over_month change in revenue for the year 2019.
This question tests date functions and window lag. It’s specifically about computing growth between months. To solve this, group by truncated month,
SUM(metric), then compute(curr - prev)/prev with LAG(). In practice, this is essential for growth tracking dashboards.Tip: Talk about how you’d smooth anomalies or seasonal effects to make the trend more meaningful.
-
This question tests filtering and subqueries. It’s specifically about finding accounts that were closed in a given timeframe. To solve this, filter accounts where status=closed and join to transactions for context. In practice, this is a KPI in banking churn analytics.
Tip: Mention adding validation to ensure date cutoffs align with time zones or business hours.
-
This question tests conditional aggregation and percentage calculations. It’s specifically about splitting comment counts by location (feed vs. mentions) and computing their share. To solve this, use
SUM(CASE WHEN … THEN 1 ELSE 0 END)to count each section, then divide by total comments and format as a percentage. In real-world product analytics, such splits reveal where engagement originates and guide UI/content placement decisions.Tip: Point out that you’d verify sample size per section before drawing conclusions from the percentages.
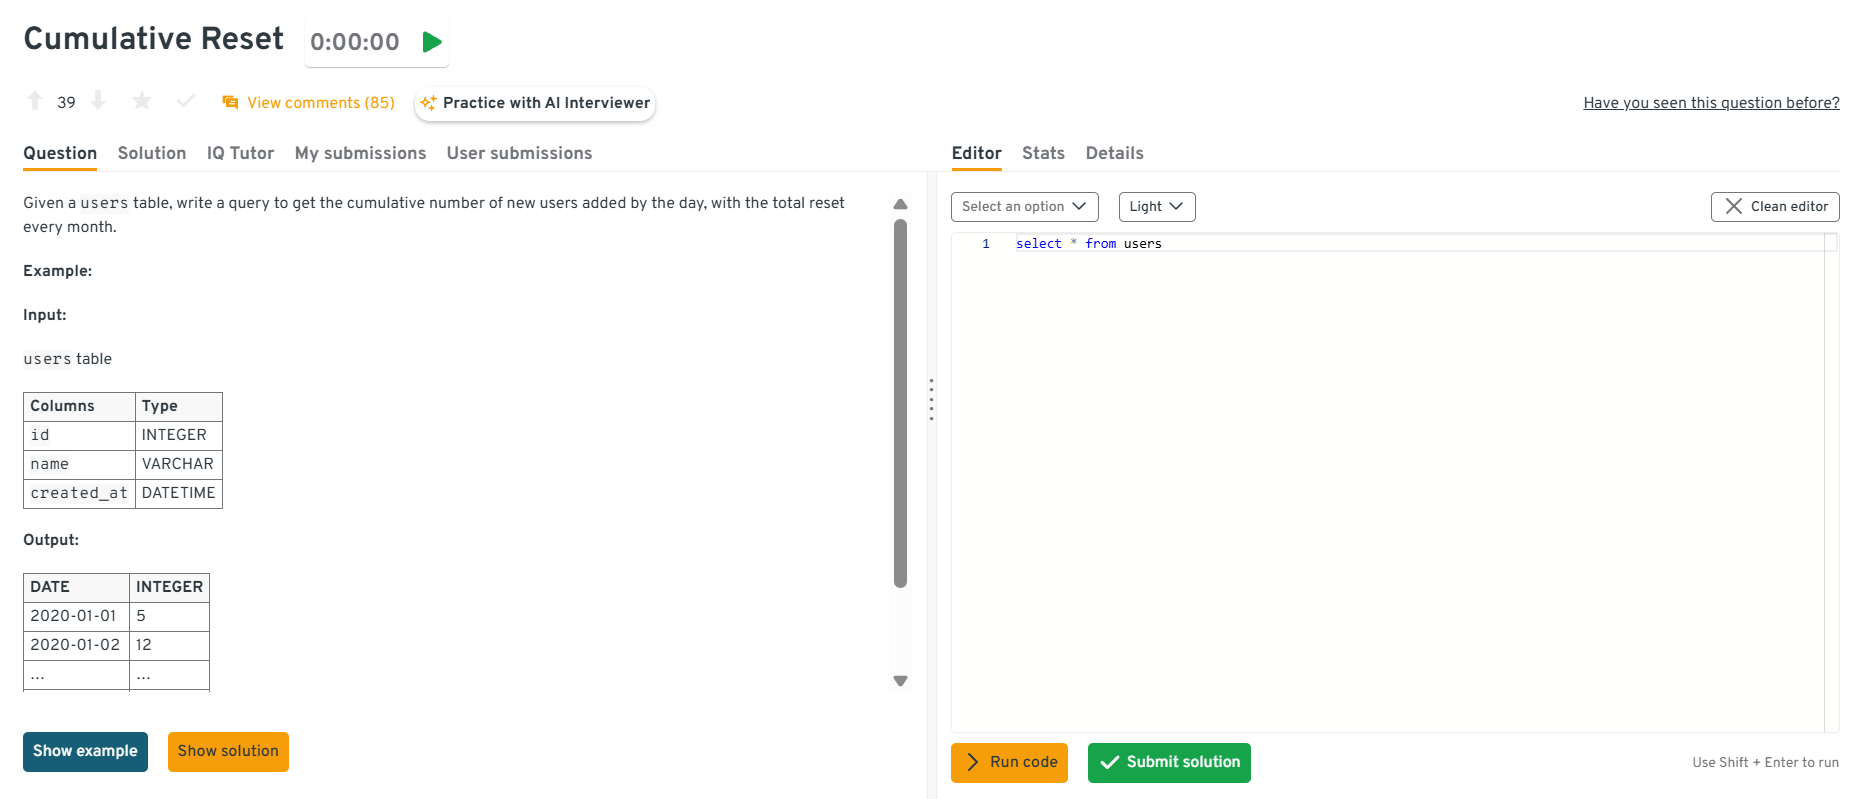
Compute cumulative users added daily with monthly resets
This question tests window framing and partition strategy on large time-series. It’s asked to evaluate if you can compute per-month cumulative counts without rescans. To solve this, use
SUM(1) OVER (PARTITION BY DATE_TRUNC('month', created_at) ORDER BY created_at ROWS BETWEEN UNBOUNDED PRECEDING AND CURRENT ROW)and ensure(created_at)clustering; validate no sort spills. In real-world BI, this feeds monthly growth dashboards with sub-second slices.Tip: Bring up how you’d monitor query performance and caching since large window functions can become expensive at scale.
Head to the Interview Query dashboard to practice the full set of Google’s interview questions. With built-in SQL testing, performance analytics, and AI-guided tips, it’s one of the best ways to sharpen your skills for Google’s data interviews.
Calculate daily minutes in flight per plane
This question tests timestamp arithmetic and grouping. It’s specifically about converting departure/arrival timestamps into minute-level duration per plane and day. To solve this, compute
EXTRACT(EPOCH FROM arrival - departure)/60, group byplane_idandflight_date, and round down fractional minutes; handle overnight flights carefully. In aviation analytics, this supports aircraft utilization dashboards.Tip: Mention accounting for edge cases like overnight flights or missing arrival times to show attention to data quality.
Write a SQL query to create a histogram of the number of comments per user in January 2020
This question is about exploring data distribution and showing that you can think statistically. You’ll count comments per user, group by frequency, and create a distribution table. What matters is your ability to describe what this data tells you about engagement, not just how to calculate it. Discuss edge cases like: How do you treat users with zero comments? Should inactive users be included? Thinking critically about these details reflects how Meta analysts work: precision balanced with context.
Tip: Treat SQL questions as opportunities to demonstrate product intuition. Showing that you understand why a metric matters is just as important as writing correct syntax.
Analytical & Quantitative Interview Questions
These questions dig into your problem-solving style and statistical intuition. Google expects you to reason through data patterns logically, define the right metrics, and interpret what the numbers truly mean.
How would you determine if a drop in Google Search traffic was due to seasonality or a product change?
Start by comparing year-over-year trends for the same period to identify seasonal dips. Next, segment traffic by geography, device, and category to see if the decline is widespread or localized. Overlay these findings with timelines of recent product changes or algorithm updates to isolate potential causes. Finally, run control-group analysis on regions unaffected by the change to confirm the impact.
Tip: Add context by mentioning how you’d visualize these patterns in a time-series dashboard to communicate insights clearly to non-technical teams.
You notice YouTube watch time increased, but ad revenue stayed flat. What’s happening?
Begin by forming hypotheses around traffic composition. The watch time might have grown from ad-free users, low-monetizing geographies, or shorter videos that host fewer ads. Analyze the breakdown of watch time by content type, region, and platform. Look for shifts toward subscription users or content without ad inventory. If necessary, check for pricing or auction algorithm changes that affected CPMs.
Tip: Highlight how you’d validate each hypothesis with data instead of guessing, this demonstrates systematic, experiment-based reasoning.
-
Start by aligning metrics with the funnel: impressions and CTR for awareness, lead-to-opportunity conversion for engagement, and customer acquisition cost (CAC) and lifetime value (LTV) for ROI. Evaluate efficiency by comparing LTV/CAC ratios across channels. Include attribution modeling (first touch, last touch, or multi-touch) to fairly distribute credit among campaigns. The key is to connect every metric to a business goal like sales pipeline growth or reduced acquisition cost.
Tip: Bring up how you’d balance short-term conversions with long-term retention to show you understand sustainable growth.
-
Pick a clear area of focus, such as improving navigation accuracy or local business discovery. Propose data-driven improvements like personalized route suggestions or better offline caching. Then, define success metrics like user retention, average time on app, route completion rate, and local engagement (like business clicks or reviews). Measure these before and after the rollout using A/B testing to quantify the impact.
Tip: Mention that you’d monitor negative indicators, like increased app crashes or drop-offs, to show you’re thinking holistically about product health.
How would you evaluate the success of a new Google Workspace pricing model?
Measure adoption rates among new users, retention among existing customers, and overall revenue growth. Track churn rate, average revenue per user (ARPU), and customer satisfaction through NPS or feedback surveys. Compare performance against control cohorts using the previous pricing model to validate that growth isn’t just correlation. Discuss trade-offs, like whether higher prices reduce user acquisition but improve long-term profitability.
Tip: Emphasize that you’d partner with finance and product teams to align pricing outcomes with business strategy, not just surface-level metrics.
Watch next: Three Tricky Analytics Interview Questions with Andrew
In this mock analytics interview, Andrew from Data Leap Tech breaks down how data professionals approach complex analytical problems, from hypothesis-driven reasoning and metric selection to handling ambiguous questions with structure. This walkthrough is especially useful for business analyst candidates, as it demonstrates how clear communication, analytical thinking, and real-world data interpretation can set you apart in Google’s interview process.
Case Study & Scenario-Based Interview Questions
Case studies are the heart of Google’s interview. They test structured thinking, analytical storytelling, and business acumen. Interviewers look for frameworks, not memorized answers.
Engagement on Google Play dropped 8% last month. How would you diagnose it?
Start by clarifying the problem scope, then segment by geography, device, and app type. Walk through metrics, sessions, retention, crash rates, and hypothesize root causes before suggesting fixes.
Tip: Think aloud. Google likes to see how you explore, not just where you land.
Design a dashboard for the Google Ads sales team.
Discuss metrics like CTR, ROI, and conversion rate, structured by campaign and region. Explain prioritizing clarity and actionability over aesthetics.
Tip: Add that you’d gather stakeholder input before building, since collaboration counts as much as design skill.
Should Google launch a new YouTube feature globally or regionally first?
Explain designing a phased rollout with control groups to test engagement and satisfaction metrics. Balance statistical confidence with business urgency.
Tip: Mention scalability, Google favors analysts who think beyond the test phase.
How would you reduce churn for Google Cloud customers?
You’d start with exploratory analysis on usage patterns and support tickets to identify churn predictors. Then, propose retention experiments like targeted outreach or tiered pricing.
Tip: Always tie actions to measurable outcomes like, “test, measure, repeat” is the Google mindset.
How would you measure the ROI of the ‘Explore Nearby’ feature in Google Maps?
Link engagement (clicks, directions started) to downstream conversions like local business visits. Then compare ROI across regions and cohorts.
Tip: Highlight how you’d quantify intangible benefits, such as user satisfaction or stickiness.
Product & Business Sense Interview Questions
These questions gauge how well you connect analytics to strategic decision-making. You don’t need to be a PM, but you should think like one—balancing data insight, business trade-offs, and user impact.
How can we measure acquisition success and evaluate the effectiveness of a free trial?
This question tests whether you think beyond sign-ups and consider retention as part of acquisition success. Start by tracking metrics like conversion rate from visitors to trial users, cost per acquisition (CPA), and trial-to-paid upgrade percentage. Then evaluate engagement and retention through activation rate, daily or weekly active usage, and churn after the trial. Use cohort analysis to understand which user groups convert best and whether short-term growth leads to long-term loyalty.
Tip: Highlight how you’d track post-trial retention to show you care about sustained customer value, not just initial conversions..
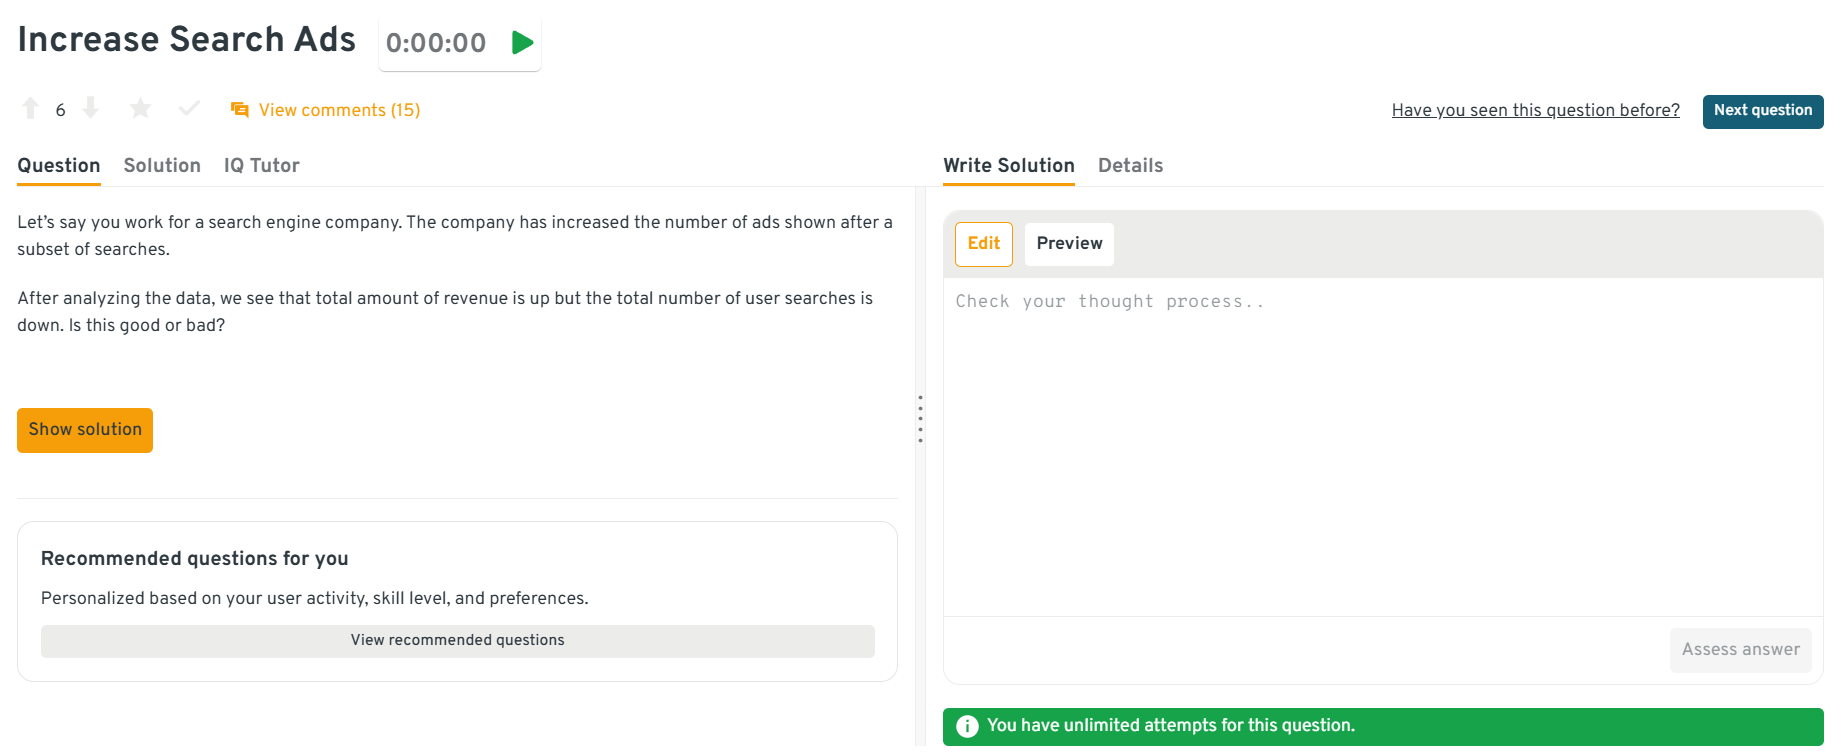
-
Begin by clarifying the business goal. If the goal was short-term revenue, the increase may look successful. However, if user experience and engagement are long-term priorities, declining search volume is a red flag. Evaluate impact holistically by measuring metrics such as average revenue per user, retention, and user satisfaction scores. Segment users by frequency and region to check if heavy ad loads are driving away loyal users.
Tip: Mention that you’d combine quantitative data with qualitative feedback to understand whether the revenue lift is sustainable or harmful to long-term trust.
Head to the Interview Query dashboard to practice the full set of Google’s interview questions. With built-in SQL testing, performance analytics, and AI-guided tips, it’s one of the best ways to sharpen your skills for Google’s data interviews.
-
Start by identifying the intent behind the change, such as improving storage efficiency or reducing clutter. Then measure its impact on key metrics such as total storage used, file restoration frequency, and user complaints about accidental deletions. Compare pre- and post-change behavior, and run an A/B test to evaluate satisfaction and support ticket volume. If the change saves resources without noticeably hurting usability, it’s a net positive decision.
Tip: Talk about how you’d monitor unintended effects, such as a spike in customer support tickets, to show you think comprehensively about outcomes.
What metrics define success for Google Pay in emerging markets?
Success for Google Pay should balance growth, reliability, and trust. Measure adoption through user growth rate, retention, transaction frequency, and average transaction value. Pair these with security and compliance metrics like fraud rate and failed transaction rate. To assess accessibility, look at metrics related to onboarding success, app load times, and payment completion in low-connectivity areas.
Tip: Emphasize that sustainable success in emerging markets depends on reliability and trust as much as on growth and transaction volume.
How do you know if a metric is meaningful?
A meaningful metric aligns with the company’s strategic goal, responds logically to product changes, and remains stable under normal conditions. You can test this by asking whether the metric predicts desired outcomes or correlates strongly with key KPIs like retention or engagement. Always evaluate whether it drives action, like if a metric changes but doesn’t influence a decision, it’s not valuable.
Tip: Include an example from experience, like refining a vague “engagement rate” into a clearer actionable metric, to show practical understanding. Google loves analytical precision.
Behavioral & Situational Interview Questions
Behavioral interviews at Google assess how you collaborate, lead through ambiguity, and communicate with empathy. Use the STAR method (Situation, Task, Action, Result) and keep your stories measurable.
What makes you a good fit for our company?
This question tests how well you understand Google’s culture and analytical mindset. Focus on values like curiosity, collaboration, and data-driven decision-making that align with Google’s mission.
Example:
“I’m drawn to Google because of its focus on solving global problems through data and innovation. As a Business Analyst, I enjoy working at the intersection of analytics and strategy. For instance, in my current project, I designed an automated reporting dashboard that improved cross-team decision-making by 20%. I believe that same blend of technical rigor and storytelling fits perfectly within Google’s data-first culture.”
Tip: Show you’ve researched Google’s products and culture. Connect your personal impact with Google’s scale of influence.
What do you tell an interviewer when they ask you what your strengths and weaknesses are?
This question evaluates self-awareness and growth mindset. Be honest, choose a relevant strength, and frame your weakness as an area you’ve actively improved.
Example:
“One of my key strengths is translating complex datasets into clear business insights. I recently built a Looker Studio dashboard that helped senior leaders visualize ad spend ROI across regions. A weakness I’ve worked on is overanalyzing before sharing results. I’ve learned to present findings earlier, inviting feedback to make insights more actionable.”
Tip: Keep your weakness real but fixable, Google values honesty paired with initiative to grow.
Tell me about a time you used data to change a business decision.
This question checks your ability to drive measurable impact through analytics. Show that you don’t just analyze data, you influence outcomes with it.
Example:
“While analyzing Google Ads campaign data for a client, I noticed that low-CTR keywords were consuming 25% of spend without conversions. I proposed reallocating the budget toward high-performing keywords based on conversion rate and ROI analysis. After the shift, our campaign efficiency improved by 15%. The insight not only reduced wasted spend but changed how our team prioritized ad investments.”
Tip: Emphasize business impact, Google wants analysts who can connect analytics directly to strategic decisions.
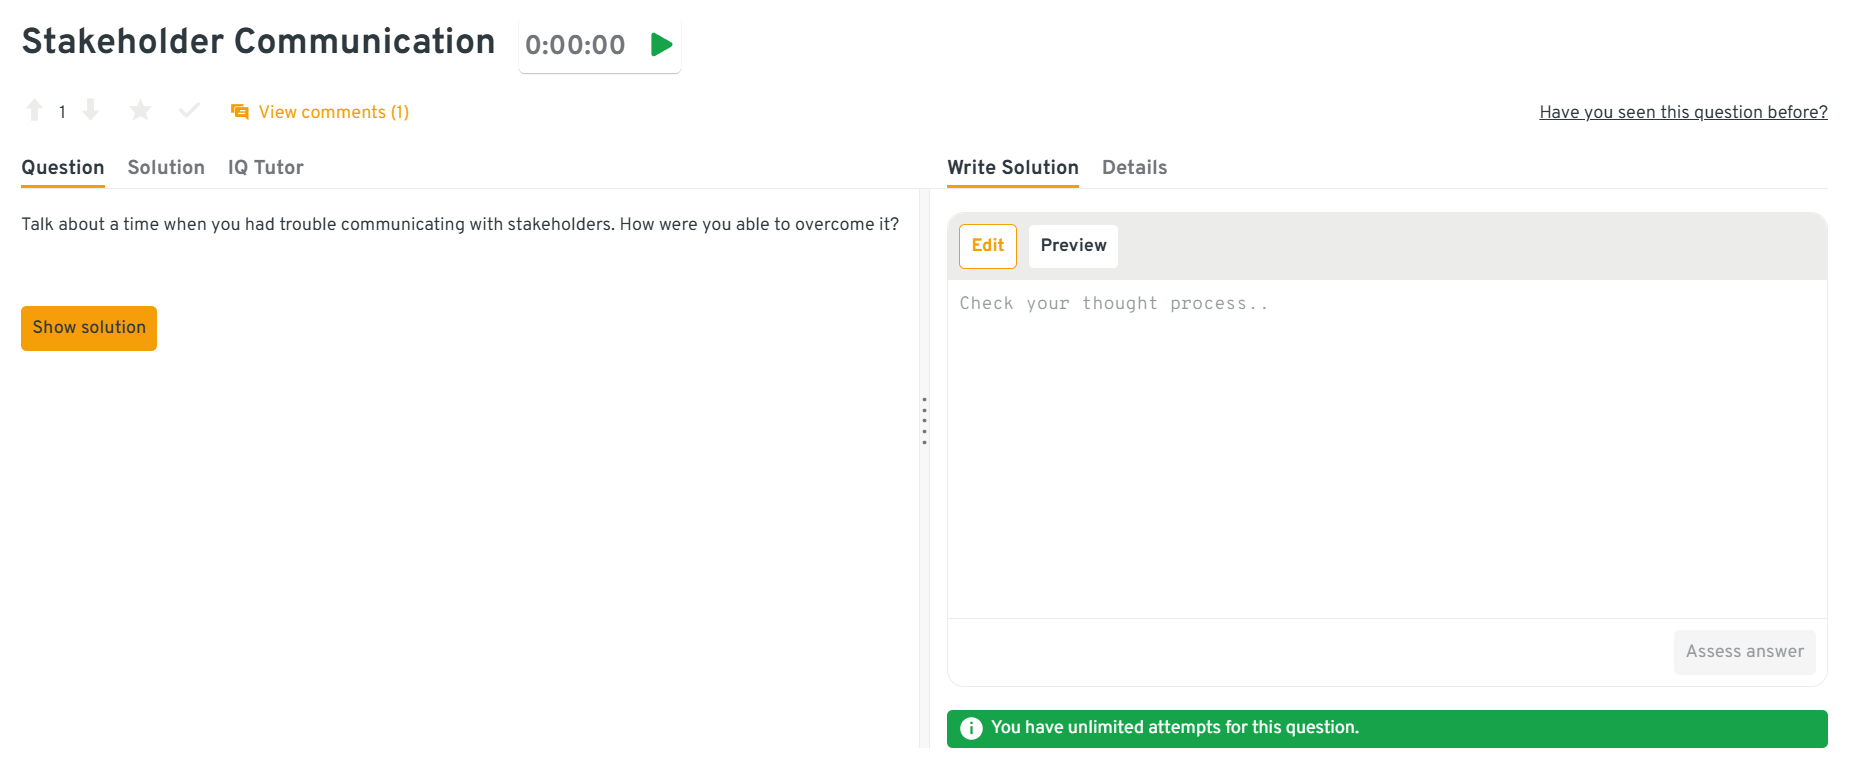
-
This question tests how you handle misalignment and maintain collaboration across cross-functional teams.
Example:
“During a Google Cloud reporting project, product managers and data engineers disagreed on how to define ‘active user.’ I realized this misalignment was creating inconsistent dashboards. I organized a sync to define shared KPIs, built a glossary in Google Sheets, and visualized the logic in Looker. Once everyone agreed, we standardized definitions across teams and reduced report discrepancies by 40%.”
Tip: Show that you listen, clarify, and create alignment. Google values analysts who bridge gaps between technical and non-technical teams.
Explore the Interview Query dashboard that lets you test yourself on real-world interview questions in a live environment. Practice this behavioral question to get instant feedback and learn how you can structure your answer for your next interview.
How do you explain complex insights to a non-technical audience?
This question examines your data storytelling and communication skills. Show that you can turn analytics into actionable insights for executives and business partners.
Example:
“In a project analyzing YouTube ad performance, I noticed that long-form ads had strong retention but lower completion rates. Instead of presenting SQL queries, I built a simple visual dashboard in Looker Studio with trend charts and annotations explaining key patterns. The marketing team used these visuals to adjust their ad sequencing strategy, leading to a 10% improvement in engagement.”
Tip: Mention how you tailor visuals or simplify terms for your audience. Google looks for analysts who make data accessible, not intimidating.
Tell me about a time you worked under ambiguity.
This question tests how you handle uncertainty and prioritize effectively — key traits for Google’s fast-moving, experiment-driven environment.
Example:
“When supporting a Google Workspace data migration project, I joined midway with unclear goals and incomplete metrics. I started by interviewing stakeholders to identify success criteria, then built a temporary SQL model to analyze user activity logs. My structured breakdown uncovered which teams were lagging in adoption, helping leadership focus onboarding efforts. Within two weeks, usage grew by 18%.”
Tip: Show that you stay calm, ask smart questions, and create clarity through structured analysis. That’s the essence of how Google analysts navigate ambiguity.
How to Prepare for a Google Business Analyst Interview
Google’s interviews don’t just test your skills, they test how you think like a Googler. The company looks for analytical curiosity, structured reasoning, and a calm, collaborative mindset under pressure. Preparation, therefore, isn’t about grinding random SQL problems; it’s about aligning your preparation with how Google measures success in analysts: clarity, impact, and adaptability.
Read more: How to Prepare for a Data Analyst Interview
Here’s how to prepare with Google’s expectations in mind.
Understand Google’s Business and Data Philosophy
Google expects analysts to think beyond metrics, to understand why those metrics matter. Before diving into technical prep, study how data drives decisions across Google’s ecosystem: from Ads optimization and YouTube engagement to Cloud revenue models and UX improvements.
Tip: Read investor reports and “Think with Google” insights to learn how the company talks about metrics like reach, engagement, and ROI so that you sound data-fluent in their language.
Master Analytical Thinking, Not Just SQL
Yes, SQL is a must-have, but Google looks for analysts who can reason through data, not just query it. Interviewers want to see how you frame business problems, validate assumptions, and turn results into insights that guide action.
Tip: As you solve SQL or data problems, narrate your reasoning. Explain what the business might infer from your result, that’s the real signal interviewers look for.
Think in Frameworks During Case Studies
When facing open-ended case studies (like a drop in engagement or launch evaluation), Google expects structure, not spontaneity. Organize your thoughts around clear analytical stages, like define the goal, identify key metrics, explore causes, and propose solutions.
Tip: Use the “clarify → segment → analyze → recommend” framework. It mirrors how analysts at Google communicate insights to cross-functional teams.
Reflect Googly Values in Behavioral Stories
Google screens heavily for Googliness, which includes traits like collaboration, empathy, and intellectual humility. Behavioral interviews aren’t checklists; they’re looking for how you work with people, not just data. Prepare stories that show curiosity, initiative, and your ability to learn fast from failure.
Tip: End every STAR story with what you learned or how it changed your approach. Reflection is a powerful differentiator at Google.
Showcase a Portfolio That Tells a Data Story
Google loves evidence of impact. Whether you’ve built dashboards, run experiments, or led academic projects, make sure each piece tells a story: What was the question, what did you do, and what changed because of it? The focus isn’t just what you built, it’s why it mattered.
Tip: Use real visuals and share a live Tableau dashboard or Google Data Studio link. It shows authenticity and confidence in your work.
Build Stamina with Mock Interviews
Google interviews are mentally demanding, combining logic, analytics, and communication in one sitting. Practicing under realistic pressure helps build the composure and pacing Google expects. Record your mock sessions, review your tone, and refine your explanations for clarity and confidence.
Tip: Focus on explaining your thought process rather than rushing to an answer, clear reasoning trumps speed at Google.
Stay Curious and Growth-Oriented
The best Google analysts never stop asking why. They explore patterns, test assumptions, and admit when they don’t know, and then figure it out. Cultivating this mindset before your interview will help you think more like a Googler and less like a candidate trying to impress one.
Tip: Curiosity and humility go hand-in-hand, so don’t be afraid to say, “I’d test that hypothesis by…” instead of pretending you already know the answer.
Comparing Google’s Business Analyst Interviews with Other Top Tech Companies
Every tech company looks for analytical thinkers, but Google’s interview philosophy stands out for its balance between data depth, product intuition, and cultural alignment. While others may emphasize speed or niche tools, Google’s focus remains on structured reasoning, communication, and curiosity.
Let’s break down how Google’s Business Analyst interviews differ from similar roles at other top tech companies.
Google vs. Amazon: Depth of Logic vs. Bias for Action
Amazon’s interview process revolves around its Leadership Principles, especially “Dive Deep” and “Bias for Action.” You’ll often be tested on how you’ve handled pressure, delivered results fast, or used metrics to drive decisions.
Google, by contrast, prizes structured reasoning and data clarity over execution speed. You’re expected to explain how you’d think through a problem rather than just what you’d do next.
Tip: When comparing your experiences, frame your answers to show both, the analytical depth Google values and the action orientation Amazon demands.
Google vs. Microsoft: Innovation vs. Precision
Microsoft’s analyst interviews lean heavily on operational analytics and business rigor, such as forecasting accuracy, data governance, and scalability. Google, on the other hand, places greater weight on innovation and cross-functional collaboration, often asking open-ended case questions like:
“How would you measure the success of a new Gmail feature?”
At Google, creativity and curiosity carry as much weight as precision.
Tip: When describing past work, emphasize exploration—how you identified opportunities through data, not just maintained accuracy.
Google vs. Meta: Structured Thinking vs. Product Experimentation
Meta’s interviews tend to be faster-paced and more product-centric, testing your ability to think in experiments and metrics: retention, engagement, activation. Google’s case interviews, by contrast, focus more on clarity and structure, such as framing problems cleanly before diving into solutions.
If Meta values hypothesis testing, Google values structured problem breakdown. You might get a prompt like:
“Engagement on Google Maps dropped 10%. How would you approach diagnosing this?”
Tip: Use frameworks. Google loves logical scaffolding since it shows you can handle ambiguity with composure.
Google vs. Apple: Analytical Breadth vs. Design Sensitivity
Apple’s analyst interviews often focus on consumer behavior and design data, like how analytics informs customer experience. Google, meanwhile, expects broader business awareness, from product metrics to ad monetization.
Apple tests storytelling through aesthetics and customer empathy; Google tests it through data narratives that drive product and market decisions.
Tip: In Google interviews, anchor your examples in impact metrics (engagement, conversions, retention) rather than design outcomes.
Google vs. Netflix: Data Storytelling vs. Decision Autonomy
Netflix analysts are expected to act like mini product managers such as proposing experiments, owning hypotheses, and defending decisions with data. Google shares this experimental spirit but adds a strong cultural layer of collaboration and peer review through hiring committees.
At Google, your storytelling, alignment with “Googliness,” and ability to connect numbers to people matter just as much as your analytical chops.
Tip: When explaining results, focus on collaboration: “We aligned findings across marketing and product” lands better than “I decided to.”
Average Google Business Analyst Salary & Negotiation Strategies
Google’s compensation philosophy centers on paying competitively for performance and potential. For Business Analysts, that means solid base pay, meaningful bonuses, and stock grants that can grow substantially with tenure and performance.
Your total compensation depends on your level (L3–L6), location, and business unit (Ads, Cloud, or Finance being the most common). Most analysts are hired between L3 and L5, with L6 reserved for senior analysts managing high-impact, cross-functional initiatives.
Tip: Clarify your level with your recruiter early in the process since Google’s leveling (L3–L6) directly determines salary bands, responsibilities, and promotion timelines.
Read more: Data Analyst Salary: What to Expect and How to Maximize Earnings
Average Google Business Analyst Salary Bands (2025-2026)
| Level | Typical Role Title | Total Compensation Range (USD) | Breakdown |
|---|---|---|---|
| L3 | Business Analyst I (Entry-Level) | $100K – $135K | Base $85K–$110K + Bonus + Equity |
| L4 | Business Analyst II / Mid-Level | $130K – $175K | Base $105K–$130K + Bonus + RSUs |
| L5 | Senior Business Analyst | $170K – $230K | Base $125K–$160K + High RSUs + Bonus |
| L6 | Lead / Principal Analyst | $220K – $300K+ | Base $150K–$180K + Substantial Equity + Annual Bonus |
Note: These estimates are based on aggregated 2025 data from Levels.fyi, Glassdoor, and TeamBlind. Actual offers vary by team, performance, and cost-of-living adjustment (Bay Area vs. Austin vs. Remote).
Tip: Always cross-verify salary data across at least two sources before negotiating. Equity and location adjustments can shift total comp significantly year-to-year.
Average Base Salary
Average Total Compensation
How Google Structures Compensation
Google’s total compensation package typically includes four core components, and understanding each helps you evaluate your offer effectively:
- Base Salary: The fixed pay, benchmarked at the high end of the industry, but often the least flexible in negotiations.
- Annual Performance Bonus: Usually 10–20% of base, tied to company and individual performance.
- Equity (GSUs): Google Stock Units vest over four years, often granted in annual refreshers for top performers. This can significantly boost long-term earnings.
- Signing Bonus or Relocation: Occasionally offered, especially for senior or hard-to-fill roles, split over your first year.
Tip: Don’t focus solely on base salary, Google’s equity growth and annual refreshers often drive the biggest long-term upside.
Negotiation Tips That Work
Negotiating at Google is more about clarity and preparation than hard bargaining. Recruiters expect informed candidates who understand their market value and can make reasoned requests.
- Confirm your level early: Your IC level defines your compensation band, so clarify whether you’re being considered at L3, L4, or L5. Even a one-level bump can increase your total offer by $40K–$70K annually.
- Use verified comp data as leverage: Reference salary data from Levels.fyi or Glassdoor to anchor your negotiation in facts. Be specific, “I’ve seen L4 Business Analyst packages average around $160K–$170K total comp.”
- Leverage competing offers professionally: Google recruiters expect candidates to compare opportunities. Phrase it collaboratively: “I’ve received another offer at $X total, but I’d love to make Google work if we can align on compensation.”
- Lead with impact, not years of experience: Google rewards scope and results over tenure. Frame your experience through measurable outcomes, “I built an analytics model that improved forecasting accuracy by 25%,” not “I have six years of experience.”
- Address location early: Google adjusts pay by region. If you’re interviewing for a hybrid or remote position, ask for the adjusted range upfront to avoid surprises.
Tip: Always negotiate calmly and factually. Google values professionalism and data-driven reasoning, it’s not about pushing, it’s about aligning value.
Evaluating Your Offer Holistically
Before signing, evaluate all components, not just the first-year number. Understand your vesting schedule, potential equity refreshers, bonus performance metrics, and long-term career trajectory. Google’s internal mobility and refresh grants often make year-three and beyond more lucrative than year one.
Tip: Ask your recruiter for a year-by-year compensation breakdown (base, equity, bonus). This helps you calculate realistic long-term value and compare offers apples-to-apples.
Common Interview Pitfalls & How to Avoid Them at Google
Even top candidates occasionally slip up during Google’s Business Analyst interviews, not from lack of skill, but from overlooking what Google actually values: clarity, curiosity, and connection between data and decisions.
Top 5 Google Business Analyst Interview Mistakes
These are the five most common mistakes candidates make, and how you can avoid them.
| Mistake | Why It Hurts | How to Avoid It |
|---|---|---|
| Jumping into the answer without clarifying the problem | Google cares more about how you think than how fast you answer. Rushing can make your response unfocused or off-target. | Pause, restate the problem in your own words, and confirm your understanding before you begin solving. |
| Over-focusing on SQL syntax instead of analysis | Interviewers want insight, not just correct queries. Syntax without reasoning doesn’t show business awareness. | Talk through your logic, explain what your query reveals, why it matters, and how you’d validate it. |
| Rambling in behavioral answers | Long, unfocused stories make you seem disorganized or unreflective. Google values concise, measurable storytelling. | Use the STAR framework, and end every answer with a clear result like “…which improved reporting speed by 20%.” |
| Failing to connect data to business impact | Listing tools or processes without outcomes misses what Google values most: measurable impact. | Tie every project or answer to a result like revenue, efficiency, or user growth. Always end with “and as a result…” |
| Neglecting “Googliness” | Technical skill alone isn’t enough. Google screens for collaboration, curiosity, and humility. | Be conversational, stay curious, and show how you learn from challenges. Data maturity and emotional intelligence go hand-in-hand. |
Tip: Treat every interview like a mini case study—slow down, structure your thinking, and communicate insights with confidence. At Google, clarity beats speed every time.
FAQs: Google Business Analyst Interview
What are the most common Google Business Analyst interview questions?
Expect a mix of SQL, analytics, and behavioral questions such as data manipulation, metric design, and stakeholder management. You’ll likely face scenario-based questions like diagnosing traffic drops or measuring new feature success.
How should I prepare for technical rounds at Google?
Focus on SQL (joins, window functions, aggregations), analytical reasoning, and case-based problem-solving. Practice explaining your logic aloud, Google interviewers care more about structured thinking than just the final query.
What certifications does Google value for business analyst roles?
The Google Data Analytics Certificate on Coursera is highly recognized, along with Tableau, Looker Studio, or SQL proficiency certificates. For documentation-heavy roles, IIBA’s CBAP or ECBA certifications add credibility.
How can I showcase my portfolio during the interview?
Bring 1–2 projects that clearly demonstrate business impact. Walk interviewers through the story — your goal, methods, insights, and measurable outcomes. Dashboards or live case studies in Looker or Tableau work best.
What salary can I expect as a Business Analyst at Google?
Most Business Analysts earn between $100K and $230K total compensation, depending on level and location. Packages usually include base pay, bonuses, and Google Stock Units (GSUs) that vest over four years.
What are typical mistakes to avoid in Google’s interview?
Don’t rush into answers or focus only on SQL syntax. Google values clarity, structure, and business connection, so explain your reasoning, link results to outcomes, and stay calm under pressure.
How is Google’s interview process different from Amazon or Microsoft?
Google’s interviews emphasize clarity and logic over speed or memorization. Amazon prioritizes leadership principles and bias for action, while Microsoft leans more on operational precision and forecasting accuracy.
Can I negotiate my compensation package at Google?
Yes, it’s expected. Discuss equity, sign-on bonuses, or relocation allowances confidently but respectfully. Always back your request with data from credible sources like Levels.fyi or Glassdoor.
What should I do if I don’t get selected for the role?
Take it as part of the process since many hires are re-applicants. Reflect on feedback, strengthen weak areas, and reapply after six months. Staying connected with recruiters helps for future openings.
What technical skills are most important for Google Business Analysts?
Proficiency in SQL, data visualization (Tableau or Looker Studio), statistics, and business communication are essential. The best candidates can translate data insights into decisions that drive measurable business outcomes.
Conclusion: Post-Interview Reflection & Next Steps
Completing your Google business analyst interview is a milestone in itself. Whether you land the offer or not, treat the process as a learning experience, because every round helps refine how you think, communicate, and connect data to decisions. Reflect on what went well, note areas to strengthen, and keep building momentum. Google values curiosity and growth as much as technical ability, so approach your next step, whether reapplying, networking, or leveling up your skills, with the same structured, analytical mindset that got you here.
Leverage Interview Query for Your Google Interview Prep
If you need structured prep, explore our full list of Interview Query questions to practice what Google actually asks and check out a Google’s success story to learn more about the experience.
Need 1:1 guidance on your interview strategy? Explore Interview Query’s Coaching Program that pairs you with mentors to refine your prep and build confidence.
With focus, feedback, and the right resources, you’ll be ready to succeed.